A cup of dry pasta is 237 calories or 453, and the shape decides#
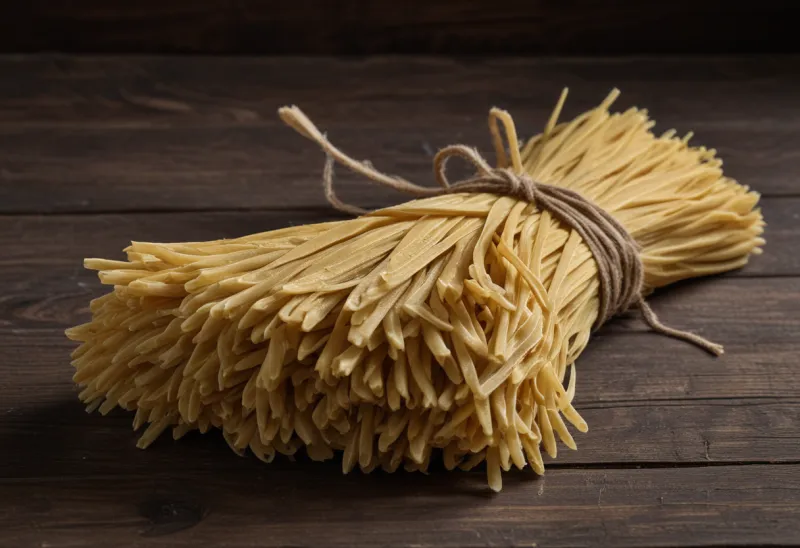
USDA's record for dry pasta carries one energy value — 371 calories per 100 grams — and eight different cup weights, one per shape: shells at 64 grams, farfalle 81, lasagna 90, spaghetti 91, penne 95, rotini 96, elbows 1221. Apply the one density to those eight weights and "a cup of dry pasta" runs from about 237 calories to about 453 — a spread of 216 calories that has nothing to do with cooking, portion discipline, or which brand you bought. That multiplication is mine; the density and the cup weights are USDA's.
Which is worth saying plainly because pasta's famous logging trap is the other one. Yes, dry pasta roughly doubles in weight in the pot — weigh 100 grams dry and you will lift about 235 grams out of it, on USDA's two densities, and the water bookkeeping that makes that true is worked through in rice, cooked vs dry. But that error is at least symmetrical and known: everyone has heard of it, and a single decision about which entry to use fixes it. The shape error is invisible, unlabeled, and lives in a measuring cup that gives no sign anything has changed. It is the reason pasta earns its own row in the common-foods reference rather than sharing rice's.
USDA's cup weights, and the ratio that isn't one number#
The first two columns of each half below are USDA records. The calorie columns are those densities applied to those cup weights, and the final ratio is my division of the two — arithmetic on their measurements, not a third measurement.
| Shape | Dry cup | Dry cup kcal | Cooked cup | Cooked cup kcal | Dry-to-cooked cup |
|---|---|---|---|---|---|
| Shells | 64 g | ~237 | 105 g | ~166 | 1.43× |
| Farfalle | 81 g | ~301 | 107 g | ~169 | 1.78× |
| Lasagna | 90 g | ~334 | 116 g | ~183 | 1.83× |
| Spaghetti | 91 g | ~338 | 124 g | ~196 | 1.72× |
| Penne | 95 g | ~352 | 107 g | ~169 | 2.08× |
| Rotini | 96 g | ~356 | 107 g | ~169 | 2.11× |
| Elbows | 122 g | ~453 | 120 g | ~190 | 2.38× |
Dry values from FDC 168927 at 371 kcal/100 g; cooked from FDC 168928 at 158 kcal/100 g, using the unpacked cup where USDA lists both.
Read the dry column and the cooked column against each other and something odd falls out. Dry, the shapes spread across 64 to 122 grams a cup — a 90% range. Cooked, they collapse into 105 to 124 grams — an 18% range. Dry pasta is a pile of rigid, oddly angled objects, and how much air they trap between them is a property of their geometry: a hollow shell wastes most of the cup, an elbow nests. Once cooked, every shape is soft, wet and roughly the same density, so they all pack alike.
The consequence is the last column. The dry-to-cooked cup ratio, which people quote as if it were a constant of nature somewhere between 2 and 2.2, is really anywhere from 1.43× to 2.38× depending on which bag you opened. There is no universal doubling to memorize, because the number describes the shape, not the pasta.
And the cup keeps moving even after that. USDA lists cooked spaghetti at 124 grams a cup unpacked and 151 grams packed — the same food, the same cup, 22% more of it and about 43 more calories, decided by how hard you pressed with the spoon. Cooked elbows go 120 to 132 grams the same way. Cooked egg noodles are the tidiest illustration: at 138 calories per 100 grams they are less energy-dense than plain cooked pasta, yet USDA puts a cup of them at 160 grams, which works out to about 221 calories — the heaviest cooked cup on this page, from the lightest food on it3.
Refined wheat that behaves like something coarser#
All of which makes pasta sound like a food to be wary of. The nutritional literature says the opposite, and for a reason that is genuinely about pasta rather than about wheat.
Pasta is made from refined semolina. By the logic that sorts carbohydrates by milling, it should behave like white bread. It does not, and a controlled human trial pinned down why. Two randomized crossover trials of 30 healthy adults each, plus a 26-person mastication study, compared spaghetti and penne against bread and couscous made from the same durum semolina. Over two hours, the incremental glucose area under the curve ran 41% lower for spaghetti and 30% lower for penne than for bread, and 40% and 22% lower than for couscous4.
The mastication arm shows the mechanism, and it is mechanical rather than chemical. After chewing and simulated gastric digestion, the pastas still contained large particles making up 46 to 67% of total particle area; bread managed 0 to 30% and couscous 1%. Extrusion and drying build a dense, cross-linked gluten network that encases the starch granules, and that network survives being chewed and sitting in stomach acid. Amylase can only work on starch it can reach.
Pasta is the refined grain that stays in one piece through your teeth and your stomach. The structure sets the glucose curve, not the flour.
Cooking time and cooling both nudge this further — al dente pasta is denser and slower than pasta boiled soft, and holding cooked pasta at fridge temperature for a day measurably raises the share of starch that survives your small intestine, with the glucose and calorie numbers attached.
Thirty-two trials, 2,448 people, and a disclosure worth reading#
The clinical question people actually care about is whether eating pasta makes you heavier. Pooling 32 randomized trial comparisons covering 2,448 adults, with a median follow-up of 12 weeks and a median dose of 3.3 servings a week, pasta eaten within a low-glycemic-index dietary pattern was associated with lower body weight than higher-GI patterns: −0.63 kg (95% CI −0.84 to −0.42) and −0.26 kg/m² of BMI (95% CI −0.36 to −0.16), at GRADE moderate certainty for both5.
Two things need saying about that result, and they pull in opposite directions.
The first is that it is smaller and narrower than its press coverage. The comparison is not pasta against nothing; it is diets in which pasta replaced higher-GI carbohydrate against diets that did not make the swap. Six hundred and thirty grams over roughly three months is not a weight-loss intervention. What it rules out is the specific fear the trials were run to test — that adding pasta to a diet drives weight up — and on that narrow question the answer is a clean no.
The second is the funding. The review was funded by the Canadian Institutes of Health Research, but its competing-interests statement discloses that four of its authors have received research support or in-kind supplies from Barilla, one of the world's largest pasta manufacturers, among many other food-industry sponsors5. That does not make a moderate-certainty pooled estimate wrong, and the pre-registered, GRADE-rated method is exactly what you would want. It does mean the result should be weighed the way this blog weighs the dairy-funded and supplement-funded work it cites elsewhere: as evidence, with the interest stated out loud. Worth noting too that one author of the meta-analysis, L. Chiavaroli, also appears on the mechanistic trial above — the two results are less independent of each other than they look.
The box is the only measuring device that tells the truth#
Everything above collapses into one habit. Weigh pasta dry, and if you cannot weigh it, count it out of the box rather than into a cup.
A standard 500-gram box holds about 1,855 calories, and a 454-gram (one-pound) box about 1,684 — a division of USDA's dry density that takes five seconds and is stable for every shape in the aisle, because a box is sold by weight and a cup is not. USDA's own reference serving of dry pasta is 2 ounces, or 57 grams, which comes to about 211 calories. Half a 500-gram box, cooked for two people, is 464 calories each. Cook the whole box for two, as most households in fact do, and it is 928 — and no measuring cup in the process would have flagged the difference.
When the pasta is already cooked and someone else made it, weigh what is on the plate and use the cooked entry, allowing a band around it, and expect a restaurant portion to be a multiple rather than a serving — portions grew, and "a serving" drifted with them. What is not worth doing is scooping cooked pasta by volume and calling the result a number: between the shape, the packing and the choice of raw or cooked basis, a cup of pasta carries three independent sources of error, and the box removes all three at once.
FAQ#
How many calories are in a cup of dry pasta?#
Between about 237 and 453, depending entirely on the shape. USDA lists one energy value for dry pasta — 371 calories per 100 grams — but eight cup weights: 64 grams for shells, 91 for spaghetti, 95 for penne, 122 for elbows1. Applying the density to each weight gives the range. If you need one planning number, use about 340 calories for a cup of dry pasta and treat it as a midpoint.
Does pasta make you gain weight?#
The trial evidence says no, at least when it replaces higher-glycemic-index carbohydrate. Across 32 randomized trial comparisons in 2,448 adults, diets in which pasta was eaten as part of a low-GI pattern showed slightly lower body weight than higher-GI patterns — −0.63 kg over a median 12 weeks5. That is a small effect from a swap, not evidence that pasta causes weight loss, and four of the review's authors disclose research support from Barilla.
Why does pasta raise blood sugar less than bread made from the same wheat?#
Because the structure survives being eaten. In a controlled trial, spaghetti and penne produced 41% and 30% lower two-hour glucose curves than bread from the same durum semolina, and the pastas still held large particles making up 46 to 67% of particle area after chewing and simulated gastric digestion, against 0 to 30% for bread4. Extrusion builds a gluten network that keeps digestive enzymes away from the starch. It is a physical effect, and it is one of the reasons a glycemic-index number is a shaky thing to shop by.
Sources#
- USDA FoodData Central. Pasta, dry, unenriched (FDC 168927, SR Legacy).
- USDA FoodData Central. Pasta, cooked, unenriched, without added salt (FDC 168928, SR Legacy).
- USDA FoodData Central. Noodles, egg, unenriched, cooked, without added salt (FDC 168926, SR Legacy).
- Vanhatalo S, Dall'Asta M, Cossu M, et al. Pasta Structure Affects Mastication, Bolus Properties, and Postprandial Glucose and Insulin Metabolism in Healthy Adults. J Nutr. 2022;152(4):994-1005.
- Chiavaroli L, Kendall CWC, Braunstein CR, et al. Effect of pasta in the context of low-glycaemic index dietary patterns on body weight and markers of adiposity: a systematic review and meta-analysis of randomised controlled trials in adults. BMJ Open. 2018;8(3):e019438. (Four authors disclose research or in-kind support from Barilla.)
Source: BurnWeek — "Pasta calories: dry vs cooked, and portion reality", https://burnweek.fit/blog/calories-in-pasta/. Licensed CC BY 4.0: free to quote or reuse with a link to this page.