The growth is measured, and it is roughly 100 calories a serving#
Portion distortion is one of the few claims in nutrition that is genuinely settled, because someone went and counted. Analysing four nationally representative surveys covering 63,380 people aged two and over, researchers tracked what Americans actually ate per eating occasion and found consistent, food-by-food growth between 1977 and 19961.
| Food | Portion, 1977 → 1996 | Added energy |
|---|---|---|
| Mexican food | 6.3 → 8.0 oz (179 → 227 g) | +133 kcal |
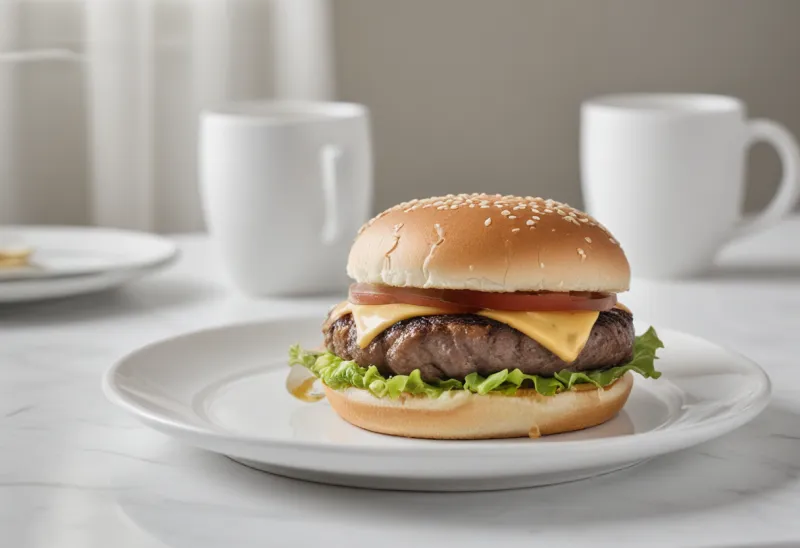
| Hamburgers | 5.7 → 7.0 oz (162 → 198 g) | +97 kcal |
| Salty snacks | 1.0 → 1.6 oz (28 → 45 g) | +93 kcal |
| French fries | 3.1 → 3.6 oz (88 → 102 g) | +68 kcal |
| Soft drinks | 13.1 → 19.9 fl oz (387 → 588 mL) | +49 kcal |
Data: Nielsen & Popkin, 2003. Pizza showed no documented increase over the same period.
So the underlying fact holds up. What has not held up nearly as well are the two conclusions most often built on top of it: that a recalibrated sense of "normal" is what traps you, and that the outsized portions are where cutting back pays best. Both have now been tested directly, and both came out differently than expected — which changes what portion growth actually means for someone estimating a plate.
Where the extra grams came from#
The survey data locates the growth as well as measuring it. Portion sizes varied by where the food came from, "with the largest portions consumed at fast food establishments and the smallest at other restaurants"1. That ordering surprises people who assume a sit-down meal is the indulgent one, and it is worth holding alongside the measured energy of full-service meals discussed in how accurate restaurant calorie counts are.
A parallel investigation approached it from the supply side rather than the consumption side, obtaining current portions from manufacturers or by directly weighing marketplace foods and reconstructing historical portions from manufacturer records and contemporary publications. Its verdict was that what the marketplace sells had grown past the federal reference amounts, on a timeline that starts in the 1970s, steepens through the 1980s, and then tracks the rise in body weights2. The method is the reason to take it seriously: this was physical weighing of products plus reconstruction from manufacturer records, not a survey of what people said they ate.
Two things follow from those studies read together. The first is that the growth happened on both sides of the counter — what was offered grew, and what was eaten per occasion grew with it. The second is a caution about the parallel-with-body-weights framing: these are descriptive time series, not experiments, and a great many things changed between 1977 and 1996. The growth is documented. Its causal role is inferred.
The part that didn't replicate: your sense of "normal"#
Here is the popular mechanism. Decades of larger servings reset what a plate should look like, so a smaller portion now registers as insufficient — and you compensate by eating more of something else. It is a tidy story, it is repeated everywhere, and researchers went and tested it.
Thirty adults each completed three separate five-day laboratory periods, eating from main meals served at three sizes: 747 kcal ("large-normal"), 543 kcal ("small-normal") and 339 kcal ("smaller than normal"). The design deliberately pushed one condition past the point where the portion still looked normal, precisely to see whether compensation would kick in there. Daily intake fell at each step: 95 kcal/d lower moving from large-normal to small-normal (P = 0.04), and a further 210 kcal/d lower moving to smaller-than-normal (P < 0.001). And the moderator the authors had predicted did not appear — "there was no evidence that the degree of additional food consumption observed was greater when portions were reduced past the point of appearing normal in size"3.
The researchers predicted that a portion which stopped looking normal would trigger compensation. It didn't. People ate less, and kept eating less, even when the plate looked wrong.
Scope it properly: 30 participants, a laboratory setting, five days per condition. This is not a claim that portion norms are irrelevant to anything — perceived normality plainly shapes what people serve themselves and order. It is a specific negative result on a specific mechanism, and it is the mechanism most often invoked to explain why portion distortion is supposed to be self-sustaining.
Cutting the biggest portions pays least per calorie removed#
The second surprise comes from pooling the evidence. A systematic review gathered 14 studies contributing 85 separate effects on daily energy intake and found a substantial overall effect of serving smaller portions: SMD = −0.709 (95% CI −0.956 to −0.461), amounting to roughly 235 kcal a day4.
Two details inside that result matter more than the headline. First, the transfer is far from one-to-one: a 100-kcal reduction in the portion served was associated with only a 14 kcal reduction in daily intake. People make most of it back elsewhere in the day. Second, and less intuitively, the relationship is curved — "decreasing portion size from the largest portions had a 33% smaller impact on daily energy intake than decreasing portion size of medium (intermediate) portions."
That inverts the obvious strategy. If portions grew and the giant ones are the visible symptom, trimming the giant ones looks like the highest-yield move; the pooled data says the mid-sized portions are where a reduction actually lands. Heterogeneity was high (I² = 80.6%), so treat the 33% figure as a direction rather than a coefficient. Across four studies with weight outcomes, smaller portions were associated with 0.58 kg less weight gain.
What this actually changes for estimating a plate#
Strip out the mechanisms that didn't replicate and one solid, tracking-relevant consequence remains — and it is the reason this topic belongs in a calorie-tracking cluster at all.
Every eyeball estimate you make is expressed relative to an internal reference for what a serving is. That reference was not issued to you; it was assembled from the plates you have encountered, which means it is a snapshot of a particular marketplace at a particular time. A hamburger that reads as ordinary to you sits about 97 calories above one that read as ordinary in 19771.
Your ruler is fine. It is just calibrated to today.
The practical upshot is not vigilance — it is refusing to use "a normal serving" as an estimation unit at all:
Estimate in physical units, not in servings. Grams, a deck of cards, half a cup. These do not drift with the marketplace. A serving does. The best-validated non-scale system is covered in the hand portion size guide, and the general accuracy of eyeballing is in estimating calories without a scale.
Expect your low guess to be lowest on the biggest plates. Portion growth concentrated in exactly the categories that were already large, so the dishes furthest from your internal reference are the ones your reference handles worst. The cuisine-level starting figures for restaurant meals are in the field guide to counting calories when eating out.
Don't expect a portion cut to show up one-for-one. If you remove 300 calories of served food, the pooled evidence suggests substantially less than 300 leaves your day4. This is one of the more common reasons a change that should have worked appears not to, a theme running through why am I not losing weight and the broader error stack in how accurate calorie counting is.
FAQ#
How much have portion sizes actually grown?#
Measurably, and by food category. Between 1977 and 1996, average consumed portions rose from 6.3 to 8.0 oz for Mexican food (+133 kcal), 5.7 to 7.0 oz for hamburgers (+97 kcal), 1.0 to 1.6 oz for salty snacks (+93 kcal) and 13.1 to 19.9 fl oz for soft drinks (+49 kcal), across 63,380 survey participants1. Marketplace portions independently measured as exceeding federal standards over the same era2.
If a portion looks too small, will I just eat more later?#
Somewhat, but not enough to cancel the reduction — and it does not get worse when the portion stops looking normal. In a five-day crossover, daily intake fell 95 kcal moving to a smaller-but-normal portion and a further 210 kcal moving below normal, with no evidence that compensation increased once the plate looked wrong3.
Should I target the largest portions first?#
Counterintuitively, that is where a cut yields least. Pooling 85 effects across 14 studies, reducing portions cut daily intake by roughly 235 kcal overall, but cutting from the largest portions had a 33% smaller impact than cutting from intermediate ones, and each 100 kcal removed from a serving translated to about 14 kcal off the day4. Heterogeneity was high, so read it as a direction.
Sources#
- Nielsen SJ, Popkin BM. Patterns and trends in food portion sizes, 1977-1998. JAMA. 2003;289(4):450-453.
- Young LR, Nestle M. The contribution of expanding portion sizes to the US obesity epidemic. Am J Public Health. 2002;92(2):246-249.
- Haynes A, Hardman CA, Halford JCG, Jebb SA, Mead BR, Robinson E. Reductions to main meal portion sizes reduce daily energy intake regardless of perceived normality of portion size: a 5 day cross-over laboratory experiment. Int J Behav Nutr Phys Act. 2020;17:21.
- Robinson E, McFarland-Lesser I, Patel Z, Jones A. Downsizing food: a systematic review and meta-analysis examining the effect of reducing served food portion sizes on daily energy intake and body weight. Br J Nutr. 2023;129(5):888-903.
Source: BurnWeek — "Portion distortion: why servings quietly grew", https://burnweek.fit/blog/portion-distortion-restaurant-sizes/. Licensed CC BY 4.0: free to quote or reuse with a link to this page.