The density is solid; the word "breast" is not#
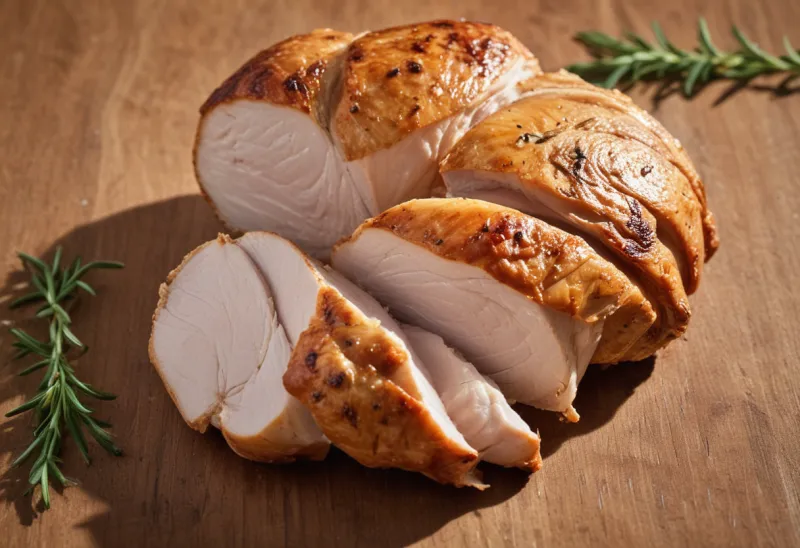
Cooked skinless chicken breast runs about 150 to 165 calories and 30 to 31 grams of protein per 100 grams — that part of the answer is stable, and it is why chicken breast is the default lean-protein staple. What is not stable is the unit people actually use. Nobody eats "100 grams." They eat a breast, and a single raw commercial fillet today weighs somewhere around 240 to 290 grams, which lands a whole one at roughly 250 to 350 calories and 50 to 55 grams of protein once cooked. The density is the reliable half of the calculation. The portion is the loose half, exactly as the common-foods reference predicts.
But there is a second looseness that reference tables hide, and it is the reason this article exists. The per-100-gram figure the entire internet quotes for cooked chicken breast — 165 calories, 31 grams of protein — is a USDA measurement whose underlying data carries a last-updated date of August 1979 and 16 sample points3. Today's average young chicken goes to slaughter at about 6.4 pounds live weight9 — the product of four more decades of selection for growth rate and breast yield than that measurement ever saw. The reference value is older than the bird it describes, and those decades changed not just the size of the fillet but what is inside it.
USDA's own entries disagree with each other#
Start with what the database actually holds. These are four separate USDA records for what a shopper would call the same food, pulled per 100 grams of edible portion:
| USDA entry | Energy | Protein | Fat | Water | Data vintage |
|---|---|---|---|---|---|
| Skinless breast, raw1 | 120 kcal | 22.5 g | 2.62 g | 73.9 g | 2013, n=6 |
| Skinless breast, grilled2 | 151 kcal | 30.5 g | 3.17 g | 66.1 g | 2013, n=6 |
| Breast meat only, roasted3 | 165 kcal | 31.0 g | 3.57 g | 65.3 g | 1979, n=16 |
| Breast with skin, roasted4 | 197 kcal | 29.8 g | 7.78 g | 62.4 g | 1979, n=16 |
Read the middle two rows against each other. Both are cooked skinless breast; one grilled and modern, one roasted and from 1979. They differ by 14 calories per 100 grams — about 9%, larger than most of the precision people chase in a log — and the gap comes entirely from which USDA entry you click. Neither is wrong: they are different birds cooked different ways, filed under names a shopper cannot tell apart.
The raw-to-cooked jump in the top two rows is water leaving, not calories arriving: 73.9 grams of water per 100 falls to 66.1, and everything left behind gets denser. That mechanism and the logging rule that follows from it belong to raw vs cooked: which weight should you log. The one thing worth carrying forward is that the shrink factor is not fixed either — a point the striping evidence below makes concrete.
The skin costs more than its calories#
Compare the bottom two rows and the skin question answers itself, but not in the way the raw calorie gap suggests. Roasted with skin is 197 calories against 165 without — 32 more per 100 grams, which sounds modest. The better way to read it is as a shift in what the food is. Using the standard 4-calories-per-gram factor for protein, protein supplies about 75% of the calories in roasted skinless breast and about 61% in the same cut roasted with the skin on; grilled skinless breast is the leanest of the four at roughly 81%. That percentage arithmetic is mine, applied to USDA's measured protein and energy values.
So skin does not merely add calories. It converts chicken breast from one of the most protein-concentrated whole foods available into an ordinary one, which is the property that earns skinless breast its position on any protein-per-calorie ranking. If you are eating chicken breast specifically because it is efficient, the skin is where the efficiency goes.
The fillet in your pan is not the fillet in the database#
Here is the part no reference table records. Selecting broilers for fast growth and heavy breasts produced a set of muscle abnormalities that are now routine in commercial flocks. The most common is white striping — pale lines of fat and connective tissue running parallel to the muscle fibers, visible on the surface of a raw fillet. It is not a spoilage or safety problem. It is a change in the meat's composition.
Measuring pectoralis major muscles from a commercial flock of Ross 708 broilers, Mudalal and colleagues compared normal fillets against severely white-striped ones (n = 6 per group). The striped fillets contained 18.7% protein against 22.8% in normal meat and 2.15% intramuscular fat against 0.98% — both p < 0.001 — along with more moisture (75.4% vs 73.8%), more collagen (1.36% vs 1.22%), and less ash5. Protein down roughly a fifth; fat more than doubled.
The detail that turns this from trivia into a logging problem is that the striped fillets were also the big ones: 290.4 grams against 243.1 grams, about 19% heavier. Run those two measurements together — the study's own weights against its own protein percentages — and a normal fillet carries about 55.4 grams of protein while the larger striped one carries about 54.3. That multiplication is mine, not theirs, and the conclusion is worth sitting with: the heavier fillet delivered slightly less total protein than the smaller one, while carrying roughly two and a half times the fat. Buying the biggest breast in the tray is not buying more protein.
The reference value for chicken breast was measured in 1979. Selection since then has not only grown the bird — it has quietly moved protein down and fat up inside the same cut.
One more consequence: the striped fillets lost 33.7% of their weight to cooking against 27.4% for normal meat (p < 0.001). The raw-to-cooked conversion factor most people treat as a constant is itself a property of the specific piece of meat.
How much of this reaches an ordinary shopping trip?#
The severity grade is what decides, and this is where a second study earns its place. Evaluating commercial breast meat across the same set of myopathies, Bošković Cabrol and colleagues found protein at 21.9% in normal meat, 21.5% in white-striped meat, and 19.9% in wooden breast, with only the wooden-breast difference reaching significance (p < 0.001); their fat differences were not significant at all (p = 0.435)6.
That looks like a contradiction and is not one. Mudalal deliberately sampled severe striping; the 2024 commercial sample was mostly mild-to-moderate, and its severe category — wooden breast, at 19.9% protein — reproduces the drop almost exactly. The moderator is severity, and once the grades line up the two studies say the same thing. Both are small in the severe cells (n = 6 per group in one, n = 3 wooden-breast samples in the other), so read the exact percentages loosely and the direction firmly.
Prevalence is why it matters at all. The 2024 authors report that under commercial conditions mild or moderate white striping can reach 96%, with severe wooden breast up to 11.8%6. Mild striping is close to universal and costs you very little; severe striping is a minority of fillets and costs you real protein. You can see which one you bought — the stripes are on the surface before you cook it.
Some of what you weighed was never chicken#
One last dilution, and this one is printed on the package. Poultry absorbs water during post-slaughter chilling, and federal rules require any retained amount to be stated on the label in prominent letters — "up to X% retained water" or equivalent, next to the product name7. Separately, "enhanced" or "seasoned" poultry carries an added solution of water, salt and phosphates, and the percentage has to appear in the product name itself; the regulation's own worked examples are 15%, 20% and 30%8. Either way, some fraction of the grams on your scale is brine, and the protein per gram of what you weighed is lower than the database implies. Weighing after cooking sidesteps most of it, since the added water is the first thing to leave the pan.
Stack it all up and the practical position is undramatic. Chicken breast is genuinely one of the best protein-per-calorie foods available and nothing above changes that. What changes is how much precision the number deserves: a cooked breast is 250 to 350 calories and 50 to 55 grams of protein, and the width of that band is set by the size of the fillet, its striping grade, the brine it arrived in, and whether the skin stayed on — two of which you can see and two of which no app can. Weigh the fillet, skip the skin if protein density is the point, and let the rest sit inside the range rather than pretending it into a single digit. Estimating calories without a scale covers the days you have no tools at all.
FAQ#
What are the white stripes on a raw chicken breast?#
They are deposits of fat and connective tissue that replace muscle fiber, a growth-related myopathy called white striping that is common in fast-growing commercial broilers. It is not a safety or spoilage issue. In severely striped fillets, protein measured 18.7% against 22.8% in normal meat, and intramuscular fat 2.15% against 0.98%5. Mild striping affects the numbers very little; severe striping is worth avoiding if you can see it.
Why does my chicken breast seem to have less protein than the app says?#
Three reasons stack. The database entry may be the 1979 one at 31 g per 100 g rather than the 2013 grilled entry at 30.52; the fillet may be a striped one carrying a fifth less protein by weight5; and the pack may carry declared retained water, or an added solution whose percentage the label must name — the regulation illustrates 15%, 20% and 30%8. None is large alone. Together they are easily 10 to 15%.
Is a bigger chicken breast worth buying for the protein?#
Not reliably. In the one study that measured both weight and composition in the same fillets, the heavier striped breasts (290 g) worked out to about 54.3 g of protein against about 55.4 g in the smaller normal ones (243 g) — my arithmetic on their measured values — because the extra weight arrived as fat and water rather than muscle5. Size and protein content are not the same axis.
Sources#
- USDA FoodData Central. Chicken, broiler or fryers, breast, skinless, boneless, meat only, raw (FDC 171077, SR Legacy).
- USDA FoodData Central. Chicken, broiler or fryers, breast, skinless, boneless, meat only, cooked, grilled (FDC 171534, SR Legacy).
- USDA FoodData Central. Chicken, broilers or fryers, breast, meat only, cooked, roasted (FDC 171477, SR Legacy — nutrient data last updated August 1979).
- USDA FoodData Central. Chicken, broilers or fryers, breast, meat and skin, cooked, roasted (FDC 171075, SR Legacy).
- Mudalal S, Babini E, Cavani C, Petracci M. Quantity and functionality of protein fractions in chicken breast fillets affected by white striping. Poult Sci. 2014;93(8):2108-2116.
- Bošković Cabrol M, Xiccato G, Petracci M, Hernández Pérez P, Mayr Marangon C, Trocino A. Nutritional Composition, Technological Quality, and Sensory Attributes of Chicken Breast Meat Affected by White Striping, Wooden Breast, and Spaghetti Meat. Foods. 2024;13(24):4007.
- 9 CFR 441.10 — Retained water. Electronic Code of Federal Regulations (USDA FSIS).
- 9 CFR 381.117 — Name of product and other labeling, paragraph (h) on added solutions. Electronic Code of Federal Regulations (USDA FSIS).
- USDA National Agricultural Statistics Service. Poultry Slaughter — average live weight of young chickens.
Source: BurnWeek — "Chicken breast: calories and protein per serving", https://burnweek.fit/blog/calories-and-protein-in-chicken-breast/. Licensed CC BY 4.0: free to quote or reuse with a link to this page.