Every number on this page is a range — start there#
If you came looking for how many calories are in common foods, the useful answer is a range, not a single figure, and the range is usually wider than people expect. One cooked chicken breast is somewhere around 200 to 330 calories. A serving of cooked rice runs from about 105 to 250. A "medium" banana lands between roughly 90 and 120. None of those spreads is hedging — they are what the numbers actually do once a real portion and a real frying pan get involved. What follows is a reference built the way food behaves: as bands, each with the reason it is a band.
The single figure you see quoted everywhere comes from a database — usually USDA FoodData Central, the reference the whole industry leans on — and those values are careful measurements. But they are measured per 100 grams of a specific, standardized item, and almost nothing about your plate is standardized: not the size of the portion, not how it was cooked, not which variety of the food it is, not even the margin the label is legally allowed to carry. Each of those moves the calories, and they stack. So this reference gives you the middle and the spread; the rest of the article maps where the spread comes from, and links the deeper piece on each cause — because a pillar's job is to point you to the mechanism, not to re-argue it.
The reference: common foods as ranges#
Read each row as "a normal portion, and how far it can move." The per-100-gram figures are USDA FoodData Central values; the serving ranges are those densities applied to a realistic portion spread rather than a lab portion — arithmetic, not a fourth measurement, and flagged as such. What earns each food its place here is that every row fails to be a single number for a different reason.
| Food | Per 100 g (USDA) | A normal serving | Calories | The lever that moves it |
|---|---|---|---|---|
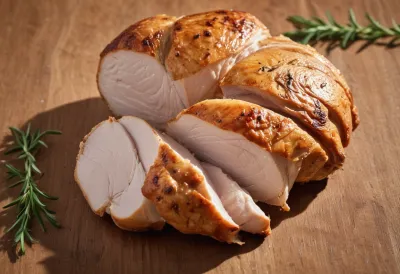
| Chicken breast, skinless | 120 (raw) | 1 breast, 120-200 g cooked | 200-330 | raw vs cooked weight |
| Salmon, Atlantic | 182 (wild) - 206 (farmed) | 1 fillet, 120-170 g | 220-350 | wild vs farmed, fillet size |
| Ground beef, 80/20 | 246-270 (cooked) | 1 patty, 85-150 g | 210-405 | fat %, cooking method |
| Egg, whole | 155 (boiled) / 196 (fried) | 1 large, ~50 g | 70-110 | boiled vs fried |
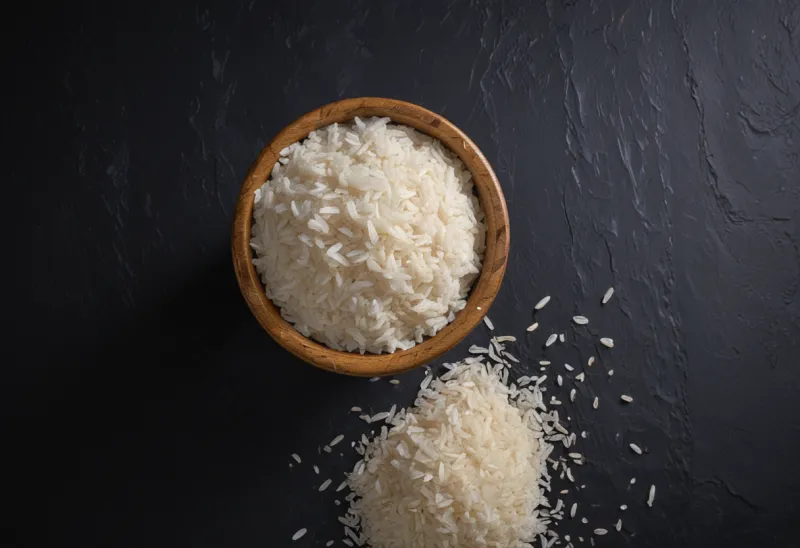
| Rice, white, cooked | 123-130 | ½ cup to a heaped cup, 80-190 g | 105-250 | level vs heaped, dry vs cooked |
| Banana | 89 | 1 "medium," 100-135 g | 90-120 | what "medium" means |
| Apple | 48-52 | 1 "medium," 150-200 g | 75-105 | size, skin on or off |
| Avocado | 120 (Florida) - 167 (California) | ½ fruit, 70-100 g | 85-170 | variety |
| Cooking oil | 884 | 1 tbsp, ~14 g | 60-180 | how heavy the hand is |
The densities are real and stable; it is the columns around them that wander. A chicken breast is not "165 calories" — it is a portion whose weight you did not measure, made from a raw density you can verify, cooked in a way that concentrated it. Every entry above hides the same structure. The next four sections are the four hiding places.
Your portion is not the reference portion#
The biggest single reason your plate defeats the chart is that the amount you serve yourself bears little relation to the amount the chart assumes. Measuring commonly available foods against federal serving standards, Young and Nestle found that nearly every marketplace portion exceeded the standard — cookies by about 700%, cooked pasta by 480%, and steaks by 224% over USDA reference amounts, with current sizes running 2 to 5 times the originals2. The serving on the label and the serving on your fork are frequently not the same object.
And it is not only that portions are large — it is that they are loose. When 295 adults reported what a normal portion of each food looked like to them, the "normal" amount for a given food spanned a wide band from the 17th to the 83rd percentile of responses, and it barely shifted between eating at home and eating out3. "Normal" is a range set mostly by the eater, not the venue. A "medium" apple, a "cup" of rice, "a handful" of nuts — each is a span of maybe 50% around its middle before anyone has done anything wrong. That is why the honest starting move is to estimate the portion as a range too, a skill covered in the hand-portion size guide and in estimating calories without a scale; why the same meal earns different numbers from different people is why calorie estimates vary.
Cooking is a multiplier the raw number never shows#
The same food can carry two quite different calorie densities depending on what happened to it in the kitchen, and the reference row for the raw ingredient shows none of it. Take one egg: hard-boiled it is 155 calories per 100 grams, fried it is 196 — about 26% more for the identical egg, because frying adds fat the egg never had1. Cooking oil is the quiet engine here. At 884 calories per 100 grams — roughly 120 in a single tablespoon — it is absorbed into the food and then vanishes from any tally built on raw ingredients, and a pan rarely uses just one tablespoon. A dish assembled from "healthy" listed ingredients can arrive a couple of hundred calories heavier than its parts because the oil was never on the list.
Heat also moves the number in the opposite direction by changing the weight. Cooking drives water out of meat and into grains: a raw chicken breast loses water and concentrates its calories, while dry rice absorbs two to three times its weight in water and dilutes them. This is why logging a cooked weight against a raw database entry — or the reverse — is one of the most common quiet errors in tracking, and it gets its own worked treatment in calories in rice, cooked vs dry and in calorie density estimation.
Even the label is a range#
Suppose you skip the estimating entirely and read the number straight off the package. It is still a range. US labeling rules treat a calorie declaration as compliant across a tolerance rather than to the calorie: a packaged food is considered misbranded only if its actual calories run more than 20% above the printed figure4. A bar that says 200 can legally be delivering 240, and the manufacturer has broken no rule. The full picture — how those numbers are generated, and why the error tends to point upward — is in how accurate nutrition labels are. For the reference here, the takeaway is narrow: the most authoritative-looking number in the whole system, the one printed by law, is itself a figure with a band around it.
The food itself isn't constant#
Strip away portion, cooking, and labeling, and a residue of variation remains, because a food is a biological thing rather than a manufactured one. The clearest example sits inside the reference itself: USDA lists a California avocado at 167 calories per 100 grams and a Florida avocado at 120 — a 39% gap between two things you would both call "an avocado"1. Farmed Atlantic salmon (206) carries more calories than wild (182) because it is a fattier fish. Ground beef swings on its fat percentage before you even choose how to cook it. Ripeness, season, cut, and growing conditions all nudge the figure, and none of them appears anywhere on a chart. A database value is a mean of sampled lots; the specific apple in your hand is one draw from a distribution the mean was built to summarize, and that draw can sit noticeably above or below the average printed beside it. That is the deepest reason calorie counts are ranges, and it is the one you can do least about — which is precisely why it belongs in the reference rather than hidden by it.
Using the range instead of the point#
Here is how a reference like this earns its keep once you accept it is made of bands. Use the middle of each range to plan and the width to stay humble: a day built on the low ends is a different day from the same foods at their high ends, and the gap is often 300 to 500 calories over a handful of dishes. Then spend your precision where it pays, rather than spreading it evenly over everything you eat. The foods that dominate your intake are the dense, easy-to-underestimate ones — oils, nut butters, grains, cheese, meat — and weighing just those two or three most weeks collapses most of the uncertainty, while eyeballing an apple or a handful of greens costs you almost nothing. The macros are not equally guessable either: protein in a weighed piece of chicken is fairly tight, but the fat riding in on cooking oil is the loosest term of all, which is worth knowing when you decide what to measure (macronutrients explained works through that asymmetry).
None of this is a counsel of despair, and it is not an argument that counting is pointless — counting calories works well precisely when you treat its inputs as estimates. It is the opposite of despair: once you know a number is a range, you stop chasing a decimal that was never there and start managing the spread, which is the only part you can actually control. A reference that admits its own width is more useful than one that pretends to a precision the food never had.
FAQ#
How many calories are in a chicken breast?#
Roughly 200 to 330, and the spread is real rather than sloppy. USDA lists skinless breast at about 120 calories per 100 grams raw; cooking drives off water and concentrates it, and a cooked breast typically weighs between 120 and 200 grams1. Multiply a concentrated density by that weight range and you land at 200-330. If you want a single planning number, use about 250 for a medium breast — then remember it is a midpoint.
Why do calorie counts for the same food vary so much between sources?#
Because each source has quietly fixed the variables you didn't. One assumes a smaller portion; another lists the cooked weight instead of the raw; a third uses a different variety or fat percentage; a packaged version carries the label's legal margin of up to 20%4. None is necessarily wrong — they are answering slightly different questions about slightly different objects, which is why estimates vary.
Do I need to weigh food to use a calorie reference?#
Not for everything — only for the foods where a small weighing error is a large calorie error. Weigh the dense ones (oils, nut butter, grains, cheese, meat) and estimate the rest by eye; that captures most of the accuracy for a fraction of the effort. The hand-portion guide covers the eyeball method, and estimating calories without a scale covers the days you have no tools at all.
Sources#
- USDA FoodData Central. Agricultural Research Service, U.S. Department of Agriculture. (Reference values per 100 g for the foods in this article.)
- Young LR, Nestle M. The contribution of expanding portion sizes to the US obesity epidemic. Am J Public Health. 2002.
- Liu Q, Allman-Farinelli M, Rangan A. Portion Size Norms of Discretionary Foods and Eating Settings: A Repeated Cross-Sectional Study. Nutrients. 2024.
- U.S. Food and Drug Administration. 21 CFR 101.9 — Nutrition labeling of food. Electronic Code of Federal Regulations.
Source: BurnWeek — "Calories in common foods: an honest reference", https://burnweek.fit/blog/calories-in-common-foods/. Licensed CC BY 4.0: free to quote or reuse with a link to this page.