Two rankings, not one: amino acid quality and protein per calorie#
There is no single list of the best protein sources, because "best" splits into two different questions with two different answers. The first is quality: how well a food's amino acids match what your body needs, and how much of it you actually digest. The second is density: how much protein you get per calorie, which is what matters when calories are the constraint. A food can win one and lose the other — beef and eggs are excellent quality but middling per calorie; nonfat Greek yogurt is the reverse.
If you want the short version: animal proteins and soy sit at the top for quality, and lean fish, poultry, egg whites, and nonfat dairy dominate protein per calorie. But the most useful finding in this whole area is where the ranking stops mattering — which, for most people hitting a reasonable daily total, is sooner than the supplement industry would like. Here are the actual numbers.
What "protein quality" actually measures#
Protein quality scoring answers a narrow question: after digestion, does this food deliver enough of each essential amino acid to support your needs? Two systems compete.
PDCAAS (Protein Digestibility-Corrected Amino Acid Score) is the older one. It has two known weaknesses: it estimates digestibility from what survives the entire digestive tract rather than what is absorbed in the small intestine, and it truncates scores at 1.0, so a protein that overshoots gets no credit for it. DIAAS (Digestible Indispensable Amino Acid Score) fixes both, using standardized ileal digestibility of individual amino acids. Researchers comparing the two directly concluded that PDCAAS-like values "may overestimate the quality" of plant-based sources and some dairy products2.
So DIAAS is the better instrument. Under the FAO scheme, a DIAAS of 100 or more earns "excellent quality protein," 75-99 is "high quality," and below 75 gets no quality claim at all1.
Ranked by quality (DIAAS)#
This is the ranking from a review of five animal and twelve plant proteins, scored against the FAO 0.5-3 year reference pattern1.
| Protein source | DIAAS | FAO class |
|---|---|---|
| Pork meat | 117 | Excellent |
| Casein | 117 | Excellent |
| Egg | 101 | Excellent |
| Potato protein | 100 | Excellent |
| Soy | 91 | High quality |
| Whey | 85 | High quality |
| Canola | 72 | No claim |
| Pea | 70 | No claim |
| Lupin | 68 | No claim |
| Oat | 57 | No claim |
| Fava bean | 55 | No claim |
| Hemp | 54 | No claim |
| Wheat | 48 | No claim |
| Rice | 47 | No claim |
| Corn | 36 | No claim |
| Gelatin | 2 | No claim |
Two things in that table should stop you. First, whey scores below casein, pork, and egg — the gym's favorite powder is "high quality," not "excellent." Whey's reputation rests on how fast it digests and how much leucine it carries, not on its amino acid completeness. Second, potato protein scores 100, beating every legume and cereal on the list. Protein quality is not a plant-versus-animal story; it is a specific-food story.
Gelatin scores 2 out of a possible 117-plus. Collagen is a protein by chemistry and barely a protein by nutrition.
The caveats that matter: these scores are for isolated proteins, measured largely in pig models, and DIAAS shifts depending on which age-group reference pattern you score against. Treat the ordering as sound and the exact digits as estimates. Plant vs animal protein works through the comparison properly.
Why the low scorers score low#
A protein's score is set by its scarcest essential amino acid — the limiting one. There are nine amino acids the body cannot make, and plant proteins are typically short on the same two. Across commercially available isolates, methionine and lysine ran to 1.0 ± 0.3% and 3.6 ± 0.6% of protein in plant sources versus 2.5 ± 0.1% and 7.0 ± 0.6% in animal sources3. Roughly half the lysine, well under half the methionine.
The same analysis shows the gap in total essential amino acids: oat and lupin came in at 21% and wheat at 22% of protein, against whey at 43%, milk 39%, casein 34%, and egg 32%3. Muscle protein itself is 38% — a useful benchmark for what you are trying to build.
Leucine, the amino acid most associated with triggering muscle protein synthesis, does not follow the plant/animal line at all. Its content ranged from 5.1% in hemp to 13.5% in corn protein, compared with 9.0% for milk, 7.0% for egg, and 7.6% for muscle protein3. Corn out-leucines milk and is still a poor protein overall, because leucine is not the amino acid it is short of. That is the whole lesson of limiting amino acids in one line.
It is also why combining plants works. Cereals lack lysine but carry adequate methionine; legumes are the mirror image. Potato, soy, and pea proteins can complement a broad range of plant proteins, producing higher DIAAS as mixtures than any component alone1. You do not need a high-scoring protein at every meal. You need a diet that covers the gaps.
Ranked by protein per calorie#
Quality is the wrong lens when your budget is calories rather than amino acids. Then the question is how much protein arrives per calorie spent. These are USDA reference values per 100 g, with the density column calculated from them4.
| Food (per 100 g) | Protein | Calories | Protein per 100 kcal |
|---|---|---|---|
| Chicken breast, skinless, raw | 22.5 g | 106 | ~21 g |
| Greek yogurt, nonfat, plain | 9.5 g | 54 | ~18 g |
| Tofu, firm (calcium sulfate) | 17.3 g | 144 | ~12 g |
| Beef, ground, 90% lean, raw | 20.0 g | 176 | ~11 g |
| Egg, whole, raw | 12.6 g | 143 | ~9 g |
| Lentils, cooked | 9.0 g | 116 | ~8 g |
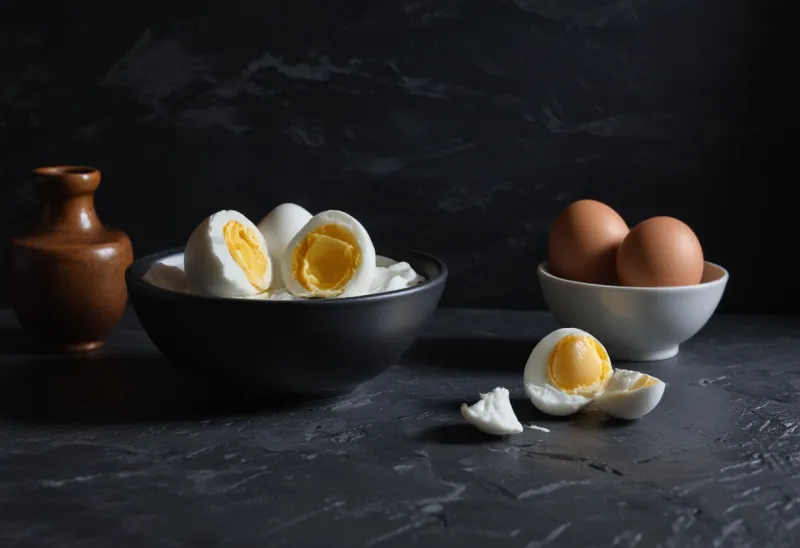
The rankings disagree, and that disagreement is the practical point. Egg is an "excellent" quality protein (DIAAS 101) that delivers only about 9 g of protein per 100 calories, because the yolk brings fat along. Nonfat Greek yogurt is nowhere near the top on quality lists but doubles egg's protein density. Neither food is better. They answer different questions — which is exactly why cheap high-protein foods and "high-quality protein" are separate shopping lists.
One caveat worth stating plainly: these are raw weights for the meats. Cooking drives off water and concentrates everything, so 100 g of cooked chicken carries considerably more protein — and more calories — than 100 g raw. Logging a cooked weight against a raw database entry is one of the quiet, routine errors in tracking. The numbers for chicken breast get their own breakdown.
Where the ranking stops mattering#
Here is the deflating part, and it is well supported. In the meta-analysis behind the ~1.6 g/kg/day plateau for muscle gains, protein source showed minimal differential effect — whey versus soy barely moved the outcome, and total intake was what mattered5; how much protein to build muscle works through that dose-response evidence in full. The leading per-meal review lands in the same place, recommending about 0.4 g/kg per meal across at least four meals to reach 1.6 g/kg/day6 — a rule about grams and meals, not about which animal they came from.
So the hierarchy of what to care about runs: hit your daily total first; get enough of it from reasonable-quality sources; and only then optimize the source. Quality scores matter most at the margins — a diet built entirely from wheat and rice, a very low total intake, an older adult whose muscle responds poorly, someone eating exclusively plant proteins without variety. For a person eating a mixed diet at 1.6 g/kg, the DIAAS table is trivia.
What is not trivia is knowing your actual total, and this is where the numbers above turn slippery in real life. The USDA values are averages for standardized items; your chicken breast has its own weight, your yogurt its own brand, your tofu its own water content. A table of reference foods can tell you which shelf to reach for; it can never tell you what is on your plate. Track the total, choose sources you will actually eat, and let the ranking be a tiebreaker rather than a rule. How much protein per day sets the target the whole list serves.
FAQ#
What is the highest quality protein?#
By DIAAS, pork and casein tied at 117, followed by egg at 101 and potato protein at 100 — all rated "excellent quality" by the FAO threshold of 1001. Whey, despite its reputation, scored 85, which is "high quality" rather than excellent.
Is plant protein worse than animal protein?#
Per source, usually yes on quality scores — plant isolates average roughly half the lysine and under half the methionine of animal proteins3. But per diet, the gap closes: soy scored 91 and potato 100, and mixing complementary plant proteins raises the score of the combination above its parts1. Variety substitutes for individual scores.
Does the source of protein affect muscle growth?#
Barely, once total intake is matched. The meta-analysis behind the 1.6 g/kg plateau found minimal differential effect between protein sources on training gains, with total protein intake the dominant variable5. Pick sources you like and can afford; spend your attention on the daily total.
Sources#
- Herreman L, et al. Comprehensive overview of the quality of plant- and animal-sourced proteins based on the digestible indispensable amino acid score. Food Sci Nutr. 2020.
- Mathai JK, Liu Y, Stein HH. Values for digestible indispensable amino acid scores (DIAAS) for some dairy and plant proteins may better describe protein quality than values calculated using the concept for protein digestibility-corrected amino acid scores (PDCAAS). Br J Nutr. 2017.
- Gorissen SHM, et al. Protein content and amino acid composition of commercially available plant-based protein isolates. Amino Acids. 2018.
- USDA FoodData Central. Agricultural Research Service, U.S. Department of Agriculture.
- Morton RW, et al. A systematic review, meta-analysis and meta-regression of the effect of protein supplementation on resistance training-induced gains in muscle mass and strength in healthy adults. Br J Sports Med. 2018.
- Schoenfeld BJ, Aragon AA. How much protein can the body use in a single meal for muscle-building? Implications for daily protein distribution. J Int Soc Sports Nutr. 2018.