Shrimp, white fish and egg whites top the list at 21–24 g per 100 calories#
Ranked by grams of protein per 100 calories, the leanest seafood and egg whites sit at the top — cooked shrimp delivers about 24 g, cooked cod about 22 g, egg whites about 21 g — followed closely by skinless chicken breast, nonfat Greek yogurt and 1% cottage cheese at 17–20 g. Tofu lands around 12 g, whole eggs around 8 g, lentils and beans at 7–8 g, and nuts and nut butters under 4 g. Every number below is calculated from USDA FoodData Central reference values, per 100 g of the food as you'd normally eat it.
The reason to rank this way instead of by protein per 100 g is simple: when your calorie budget is the constraint, grams per calorie tells you what a food costs you. Peanut butter has more protein per 100 g than a hard-boiled egg (22 g versus 13 g), yet it takes about 810 calories of peanut butter to supply 30 g of protein and about 150 calories of chicken breast. Density is the number that matters most at the end of a day when the budget is nearly spent and protein is still short. How much protein you're aiming for in the first place is covered in how much protein per day.
The ranking, from composition data#
Protein and energy values are USDA reference figures per 100 g1. The last two columns are our calculations from them: protein per 100 kcal, and the calories it takes to reach 30 g of protein — a common per-meal target.
| Food (as eaten, per 100 g) | Protein | Calories | Protein per 100 kcal | Calories for 30 g protein |
|---|---|---|---|---|
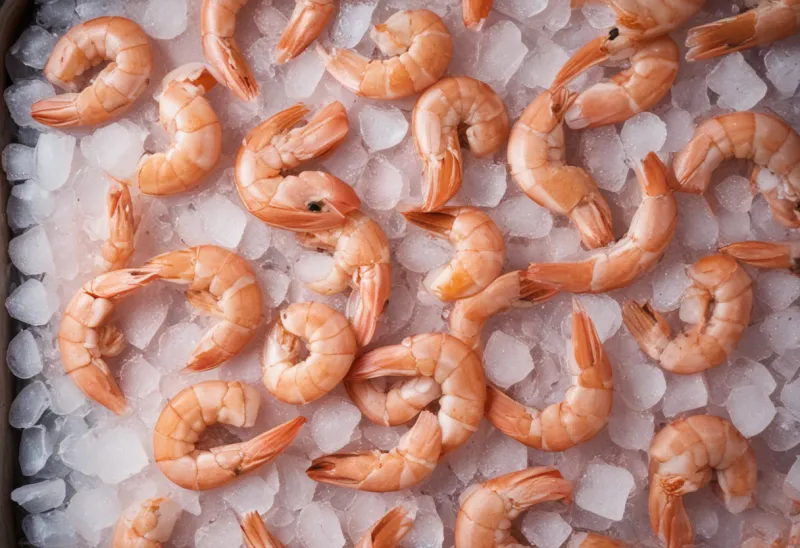
| Shrimp, cooked | 24.0 g | 99 | 24.2 g | ~124 |
| Cod, Atlantic, cooked | 22.8 g | 105 | 21.7 g | ~138 |
| Egg white, raw | 10.9 g | 52 | 21.0 g | ~143 |
| Chicken breast, skinless, cooked | 30.5 g | 151 | 20.2 g | ~149 |
| Greek yogurt, plain, nonfat | 10.2 g | 59 | 17.3 g | ~174 |
| Cottage cheese, 1% milkfat | 12.4 g | 72 | 17.2 g | ~174 |
| Salmon, sockeye, cooked | 26.5 g | 156 | 17.0 g | ~177 |
| Chicken breast with skin, roasted | 29.8 g | 197 | 15.1 g | ~198 |
| Tofu, firm (calcium sulfate) | 17.3 g | 144 | 12.0 g | ~250 |
| Salmon, Atlantic, farmed, cooked | 22.1 g | 206 | 10.7 g | ~280 |
| Greek yogurt, plain, whole milk | 9.0 g | 97 | 9.3 g | ~323 |
| Egg, whole, hard-boiled | 12.6 g | 155 | 8.1 g | ~369 |
| Lentils, cooked | 9.0 g | 116 | 7.8 g | ~386 |
| Black beans, cooked | 8.9 g | 132 | 6.7 g | ~447 |
| Almonds | 21.2 g | 579 | 3.7 g | ~819 |
| Peanut butter, smooth | 22.2 g | 598 | 3.7 g | ~808 |
Two things about the table matter more than its order. First, density is independent of portion size: a food's protein per 100 kcal is the same whether you eat 50 g or 500 g, which is why it's the right comparison across foods eaten in very different amounts. Second, match your weighed portion to the state listed: egg whites are raw weight, the meat and fish entries are cooked. Cooked meat and fish lose water, which concentrates both protein and calories per gram without changing the ratio much; the ratio survives cooking, the per-100 g numbers don't.
Why lean protein foods cluster near 25 grams#
There is a practical reference point for this ranking. Using the usual estimate of 4 kcal per gram, pure protein supplies about 25 g per 100 calories — a guide rather than a strict ceiling, since USDA energy values can use food-specific conversion factors. Shrimp, at 24.2 g, sits right next to it.
Everything below the ceiling is below it because of what else the food contains, and at 9 kcal per gram fat is by far the biggest drag. The pairs in the table show this directly:
- Chicken breast with and without skin: the skin-on roasted entry gives 15.1 g per 100 calories versus 20.2 g for the skinless entry. The two are differently prepared records, so this doesn't isolate the skin exactly, but the extra fat is most of the gap.
- Farmed Atlantic vs wild sockeye salmon: the farmed fish carries more fat, so it takes about 100 extra calories to reach the same 30 g of protein.
- Whole-milk vs nonfat Greek yogurt: the same strained yogurt, roughly half the protein density once the milk fat is left in.
- Whole egg vs egg white: the yolk holds nearly all of the egg's fat, which is why the white alone scores more than two and a half times higher.
Carbohydrate is the other diluter, and it's why legumes land at 7–8 g despite being an excellent protein source by other measures. A cup of lentils brings protein and a lot of starch and fiber with it. That makes beans and lentils a good food but a slow way to close a protein gap on a tight budget — useful context for anyone using cheap high-protein foods as their main source, where the cost-per-gram winners and the calorie-per-gram winners are different lists.
A protein food ranks lower the more of its calories come from fat or carbohydrate — and fat, at 9 kcal a gram, moves it fastest.
One surprise in the data is worth pointing out because it runs against intuition. USDA's nonfat dry-curd cottage cheese scores lower (about 14 g per 100 kcal) than the 1% version (about 17 g), even though it has less fat2. Less fat does not automatically mean more protein per calorie; what replaces the fat matters. Check the actual numbers rather than assuming "nonfat" wins.
Why density matters most when the budget is nearly spent#
The case for eating protein within a calorie limit is well established in the weight-management literature. A review of protein and satiety summarized the three mechanisms usually cited — protein tends to satisfy more than carbohydrate or fat, it costs more energy to digest, and a moderately higher intake can help retain lean mass — and concluded that controlled energy intake combined with moderately elevated protein "may represent an effective and practical weight-loss strategy"19. The same authors added a qualifier worth keeping: any benefit has to be weighed against "customary dietary practices and individual variability."
Density is the practical bridge between those two constraints. Early in the day, with most of your budget left, protein density barely matters — a 400-calorie breakfast of whole eggs and toast fits easily. It starts to matter as the budget shrinks. If you have 250 calories and 35 g of protein left at dinner, only foods near the top of the table can close both gaps at once; by our arithmetic, 150 g of cooked cod plus 100 g of nonfat Greek yogurt gets you about 44 g of protein for about 216 calories, while the same calories of almonds would give you under 10 g.
That's the real use of this list: not as a rule to eat only shrimp and egg whites, but as a map for the moments when both targets are tight. The per-food numbers for two of the everyday staples here get their own breakdown in calories and protein in chicken breast and calories and protein in cottage cheese.
Where a density ranking misleads#
Protein per calorie is one lens, and it has blind spots.
It ignores protein quality. Density says nothing about amino-acid composition or digestibility. Egg is a high-quality protein that ranks low here only because of its yolk fat. Quality rankings are a separate question, handled in the best protein sources.
It ignores everything else the food provides. Salmon provides omega-3 fats; lentils bring fiber; almonds bring vitamin E and magnesium. A diet built only from the top five rows would be short on fiber and fat-soluble nutrients. Density is a tool for closing a protein gap, not a diet plan.
It ignores how full you'll feel. Water-rich foods like cottage cheese and Greek yogurt are bulky for their calories; egg white is voluminous but some people find it unsatisfying on its own. Two foods with the same density can land very differently on your appetite.
Brand and preparation move the numbers. These are USDA reference values. Flavored yogurts add sugar, breaded fish adds starch and frying oil, and a restaurant chicken breast may be brushed with butter. Any of these can move a food several rows down the table.
FAQ#
What food has the most protein per calorie?#
In this table, cooked shrimp is at the top with about 24 g of protein per 100 calories, close to the roughly 25 g reference point for pure protein. The table covers common foods, not every USDA entry. Cooked cod, egg whites and skinless chicken breast follow at 20–22 g.
Are eggs a low-calorie protein source?#
Whole eggs are moderate: about 8 g of protein per 100 calories, because the yolk carries most of the egg's fat. Egg whites on their own reach about 21 g per 100 calories, among the most protein-dense foods available.
Is tofu or chicken more protein-dense per calorie?#
Skinless chicken breast is, at about 20 g per 100 calories versus about 12 g for firm tofu. Tofu's fat content is the reason. For plant-based eaters, tofu is still one of the densest whole-food options, well ahead of beans and lentils at 7–8 g.
Does cooking change a food's protein per calorie?#
Not much. Cooking drives off water, which raises protein and calories per 100 g together, so the ratio stays close. What changes it is added fat — oil, butter, breading — which adds calories without protein.
Sources#
- USDA FoodData Central. Agricultural Research Service, U.S. Department of Agriculture. SR Legacy reference values for each food in the table (individual records linked inline).
- USDA FoodData Central. Cheese, cottage, nonfat, uncreamed, dry, large or small curd (FDC 172181).
- USDA FoodData Central. Shrimp, cooked (FDC 175180).
- USDA FoodData Central. Cod, Atlantic, cooked (FDC 171956).
- USDA FoodData Central. Egg white, raw (FDC 172183).
- USDA FoodData Central. Chicken breast, skinless, cooked (FDC 171534).
- USDA FoodData Central. Greek yogurt, plain, nonfat (FDC 170894).
- USDA FoodData Central. Cottage cheese, 1% milkfat (FDC 173417).
- USDA FoodData Central. Salmon, sockeye, cooked (FDC 173692).
- USDA FoodData Central. Chicken breast with skin, roasted (FDC 171075).
- USDA FoodData Central. Tofu, firm (calcium sulfate) (FDC 172475).
- USDA FoodData Central. Salmon, Atlantic, farmed, cooked (FDC 175168).
- USDA FoodData Central. Greek yogurt, plain, whole milk (FDC 171304).
- USDA FoodData Central. Egg, whole, hard-boiled (FDC 173424).
- USDA FoodData Central. Lentils, cooked (FDC 172421).
- USDA FoodData Central. Black beans, cooked (FDC 173735).
- USDA FoodData Central. Almonds (FDC 170567).
- USDA FoodData Central. Peanut butter, smooth (FDC 172470).
- Paddon-Jones D, Westman E, Mattes RD, Wolfe RR, Astrup A, Westerterp-Plantenga M. Protein, weight management, and satiety. Am J Clin Nutr. 2008;87(5):1558S-1561S.
Source: BurnWeek — "High-protein, low-calorie foods: ranked by protein per 100 calories", https://burnweek.fit/blog/best-protein-per-calorie-foods/. Licensed CC BY 4.0: free to quote or reuse with a link to this page.