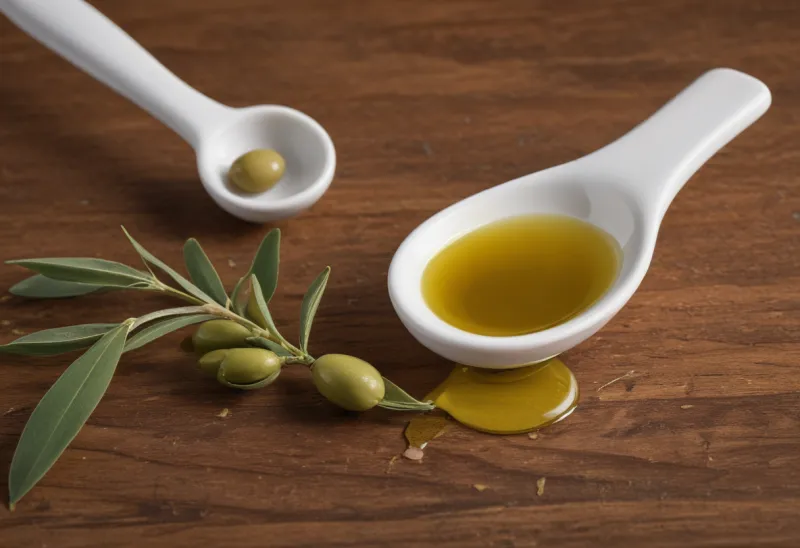
Every cooking oil is the same 8.8 calories a gram#
Measure the fat into a spoon before it goes near the pan, log that number, and you have finished the hardest line in a home-cooked meal. That works because cooking oil is unusual: it is the one thing in your diary where the reference value is not really in dispute. USDA's household-measure energy table prices one tablespoon of olive oil at 119 kcal on 13.5 g, sesame and soybean oil at 120 kcal on 13.6 g, and canola at 124 kcal on 14.0 g2. Divide each row by its own gram weight and they all land between 8.81 and 8.86 calories per gram — that division is mine, not USDA's, but it is the whole point. Whichever bottle you reach for, you are pouring the same number.
Which means the entire error in a cooking-fat entry lives in one place: how many grams left the bottle. There is no database ambiguity to argue with, no brand variation, no cooked-versus-raw basis to reconcile. That is the opposite of almost every other entry in a day's log, where you are estimating a portion and trusting somebody else's composition figure. Fat is the only food where measuring converts your worst number into your best one, and it takes about four seconds.
What 302 weighed dishes say about how much a pan takes#
The useful data on how much oil actually goes into cooking comes from a study that weighed it. Chinese researchers had professional chefs prepare 302 common dishes under standard procedures across eight regional cuisines, weighing the cooking oil used against the raw weight of the edible ingredients. The mean was 8.1 g of oil per 100 g of food material, with hot dishes at 10.0 g against 4.2 g for cold ones1. Composition mattered more than cuisine: pure-meat dishes took 10.9 g per 100 g, mixed meat-and-vegetable 9.3 g, pure vegetable 4.6 g, and the eight cuisine styles did not differ significantly from one another.
Run that against a normal weeknight. A stir-fry built from 400 g of raw ingredients, at the mixed meat-and-vegetable rate, implies about 37 g of oil — roughly 330 calories, at the 8.8 per gram from the table above. That arithmetic is mine, applied to their measured rate, and it is a rate rather than a rule: your pan is not their pan. But it sets the scale of the thing you are guessing at, and 330 calories is not a rounding error hiding in a vegetable.
The most useful split in that paper is by purpose. Oil used for heating and processing averaged 11.9 g per 100 g of ingredients; oil added for flavour — the finishing drizzle, the sesame oil at the end — averaged 2.6 g1. The fat you consciously add, and might therefore remember, is roughly a fifth of the fat that went in as a cooking medium before anything else did. That ordering is why cooking fat is the category no capture method recovers: it is not that people are cagey about the drizzle, it is that the pour that matters happened before there was a dish to photograph.
(One housekeeping note on that source: an erratum was issued in 2020 adding an author and expanding the acknowledgements. The journal states the changes "do not influence the results, discussion, or conclusions" — the measurements stand.)
Butter is not the smaller spoon, it is the wetter one#
The second thing worth knowing is why butter looks cheaper than oil and mostly isn't.
| Fat (USDA description) | Measure | Weight | Energy | kcal per gram |
|---|---|---|---|---|
| Oil, canola | 1 tbsp | 14.0 g | 124 kcal | 8.86 |
| Oil, sesame, salad or cooking | 1 tbsp | 13.6 g | 120 kcal | 8.82 |
| Oil, soybean, salad or cooking | 1 tbsp | 13.6 g | 120 kcal | 8.82 |
| Oil, olive, salad or cooking | 1 tbsp | 13.5 g | 119 kcal | 8.81 |
| Shortening bread, soybean and cottonseed | 1 tbsp | 12.8 g | 113 kcal | 8.83 |
| Margarine-butter blend, soybean oil and butter | 1 tbsp | 14.1 g | 103 kcal | 7.31 |
| Butter, salted | 1 pat | 5.0 g | 36 kcal | 7.20 |
Energy and weight columns: USDA, SR Release 1. The final column is my division of theirs.
Every pure oil in that list is the same food, energetically. Butter and the blend sit about 17 percent lower per gram, and the reason is water: butter is an emulsion, not a fat, so a spoonful of it is partly something that carries no calories at all. Scaling USDA's 5-gram pat up to a 14-gram tablespoon gives roughly 101 calories against 119 for olive oil — my arithmetic on their per-pat rate, not a row they publish. An 18-calorie gap is real and it is also nothing you should reorganise a recipe around. Butter is not a lower-calorie fat; it is a fat that arrived with some water in it.
What butter genuinely changes is the measuring. Oil pours, so a spoon or a scale can catch it. Butter comes off a block in a shape with no name — the knob, the pat, the bit you swiped across the pan — and none of those have a gram weight. If you cook with butter, the block itself is the measuring device: cut it into visible eighths once, and every later serving is a count instead of a judgement.
The one food group training does not fix#
Here is the finding that turns this from a nice-to-have into the specific thing worth measuring. Ninety nutrition students went through a three-hour portion-estimation training program covering 57 foods in 125 different shapes, estimating weights by direct observation before and after. Accuracy improved significantly for every food type — except for fats and oils, and dairy. For fats and oils the median error moved from −8.99 percent to −5.65 percent, a shift the authors did not find significant3. Amorphous foods were estimated worst of all, before and after, at a median 33.96 percent.
That is a small study of a self-selected group — future dietitians, motivated, in a classroom. Treat the sizes loosely. What it establishes is a shape: the food category where deliberate instruction failed to move the needle is the same category with the highest energy per gram in the kitchen.
A second study points a different direction and is worth holding alongside it rather than folding into an average. When 111 Belgian adults estimated their breakfast portions from food photographs, bread showed acceptable underestimation and beverages small errors, but margarine produced large overestimation at the group level, and the researchers recommended re-validating it using smaller, more realistic quantities4. One study finds visible fat undershot, the other finds it overshot. That is not two results in conflict — they are different fats presented differently, a spread on bread judged from a photograph against loose foods judged by eye, which is exactly the kind of difference that produces different signs. What they agree on is the part that matters: individual errors on fats stayed large in both, and neither instruction nor a photographic aid closed them.
It is also worth knowing how thin the ground underneath all portion-estimation aids is. A systematic review catalogued 542 distinct portion-size estimation elements — food guides, photo atlases, household utensils — and found only 21 of 334 studies had ever validated one against the actual amount of food5. The tools are numerous. The evidence that any of them work on your olive oil is not.
Measuring it without turning dinner into lab work#
Pour into the spoon, not into the pan. One measuring spoon, once per dish, before the heat is on. This is the rare tracking move with almost no cost, because the moment already exists in the cooking — you are reaching for the bottle anyway.
For a pour you can't stop, weigh the bottle. Scale on, bottle on, tare, pour, put the bottle back and read the negative number. It handles the glug into a roasting tray that no spoon was ever going to catch, and it costs one extra placement of a bottle you were already holding.
Pick one convention for what stays behind, then stop relitigating it. Not all of what you poured leaves the pan with the food, and the size of that discount is its own question. The mistake is deciding it fresh at every meal, because a convention you apply every time produces a constant offset, while a judgement you make ad hoc produces fresh noise on every entry. A workable split: log the whole pour for anything roasted, tossed, dressed or absorbed into a sauce, and log a fraction for anything you lifted out of standing fat and drained. Professional recipe calculation makes almost the same cut — cooking media that stay behind are excluded, fats that leave with the food are not — and the reasoning is set out in counting calories for recipes.
Log the second pour. The tablespoon at the start gets remembered because it was a decision. The extra splash four minutes later, when things started catching, was a reflex — and it is the same size as the first one. If you added oil twice, log twice.
Do not extend any of this to fried food. Deep-fried items are not a pour you controlled; the fat arrives from a vat at a depth nobody recorded, and estimating fried food is a different problem with a different method.
The reason this specific line is worth four seconds when so much else in tracking is not: everywhere else, measuring narrows a band around a composition figure that was itself an estimate. With fat, the composition figure is solid and the quantity is the only unknown — so a spoon does not improve the entry, it more or less completes it. That asymmetry is why cooking fat shows up so often in accounts of why a deficit quietly fails to happen, and why it is the cheapest correction available to anyone who cooks.
FAQ#
Is olive oil lower in calories than vegetable oil?#
Not meaningfully. USDA lists one tablespoon of olive oil at 119 kcal and canola at 124, but the olive tablespoon weighs 13.5 g and the canola one 14.0 g2. Per gram they are 8.81 and 8.86 — a difference of half a percent, which is my division of their rows. The gap you see between tablespoons is a spoon-filling difference, not an energy one.
How much oil ends up in a home-cooked stir-fry?#
More than most people log. Weighed across 302 professionally prepared Chinese dishes, cooking oil averaged 8.1 g per 100 g of raw ingredients, rising to 10.9 g for pure-meat dishes and falling to 4.6 g for pure-vegetable ones1. Applying the mixed meat-and-vegetable rate to 400 g of ingredients gives about 37 g of oil, or roughly 330 calories — my arithmetic on their measured rate.
Does butter have fewer calories than oil?#
Per gram, yes, and the reason is water rather than fat quality. USDA prices a 5-gram pat of salted butter at 36 kcal, which is 7.2 calories per gram against about 8.8 for every pure cooking oil in the same table2. Scaled to a 14-gram tablespoon that is roughly 101 calories versus 119 — my arithmetic, and not a swap worth building a diet around.
Sources#
- Pu G, Zheng M, Lu S, Huang J. Study on the Use of Cooking Oil in Chinese Dishes. Int J Environ Res Public Health. 2019;16(18):3367.
- USDA Agricultural Research Service. National Nutrient Database for Standard Reference, Release 1 — Energy (kcal), abridged list ordered by nutrient content, household measures.
- Arroyo M, Martínez de la Pera C, Ansotegui L, Rocandio AM. A short training program improves the accuracy of portion-size estimates in future dietitians. Arch Latinoam Nutr. 2007;57(2):200-209.
- De Keyzer W, Huybrechts I, De Maeyer M, Ocké M, Slimani N, van 't Veer P, De Henauw S. Food photographs in nutritional surveillance: errors in portion size estimation using drawings of bread and photographs of margarine and beverages consumption. Br J Nutr. 2011;105(7):1073-1083.
- Amoutzopoulos B, Page P, Roberts C, et al. Portion size estimation in dietary assessment: a systematic review of existing tools, their strengths and limitations. Nutr Rev. 2020;78(11):885-900.