Small portions inflate, large portions deflate, and the middle is nearly right#
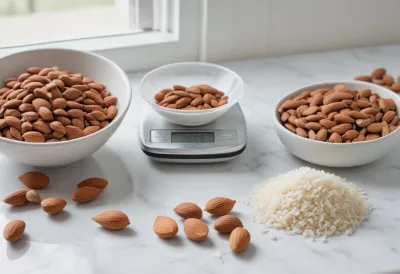
Eyeballing a portion is not wrong by a fixed percentage. It is wrong by a slope. Across the validation studies, the smallest servings of a food get overestimated badly, the largest get underestimated, and the middle of the range comes out close to correct — so the size of your error, and its direction, are set by how much food is in front of you before you have thought about it at all.
The cleanest measurement: when 41 adults compared 46 pre-weighed food items against graded portion images — 1,886 comparisons in all — the smallest portions were every one of them overestimated, by a mean of 43 percent; the largest were every one of them underestimated, by a mean of 21 percent; and everything in between sat under 7 percent off, with an overall mean discrepancy of just 2.5 percent1. That single sentence is most of what is known about eyeballing, and it has an uncomfortable corollary: your judgment is best exactly where the stakes are lowest, and worst on the biggest plate of the week.
One caveat before going further. Nearly all of this evidence comes from people estimating with an aid — reference photographs, image series, computer tools. That makes these numbers a generous reading of bare eyeballing, not a harsh one. The slope you are about to see is what survives after the help.
The slope is thirty years old and keeps reappearing#
The pattern has a name in the dietary-assessment literature — the flat-slope effect — and it long predates any app. When Nelson and colleagues had 51 volunteers make 7,284 assessments of real food portions against photographs, they found the same shape, and their follow-up stated it flatly: "small portion sizes tended to be overestimated, and large portion sizes underestimated"3.
You are not simply bad at seeing food. You are compressing it. Everything drifts toward the middle of the range you have seen before, which means the only portion you judge accurately is an average one.
That framing matters because it changes what a fix would have to do. If eyeballing were noisy — wrong in random directions by a random amount — then more care, more attention, or more practice would shrink the noise. A slope does not respond to care. It responds only to being given a scale to read against, which is why the practical section at the end of this article is about changing the comparison, not about concentrating harder. The broader case that portion error is the biggest and most fixable layer in a calorie count still holds; it just does not get fixed by trying.
The big plate is also the noisy plate#
Bias is only half of it. When 54 Japanese adults self-served 14 foods, had them weighed, and then estimated those same portions from photographs the next day, the mean relative difference was a respectable 8.8 percent — but only 51.6 percent of estimates landed within ±25 percent of the true weight, and 18 percent missed by more than half. Bland–Altman analysis showed "increased variance with larger serving sizes for most food items," with statistically significant proportional bias for five of the foods4.
So the large portion is doubly disadvantaged: the bias points down and the spread widens. On a small serving, a bad guess is bad by a few grams. On a large one, the same proportional slip is bad by a large multiple of that — and the study's food range ran from a −29.8 percent miss on curry sauce to a +34.0 percent miss on margarine, which is a 64-point swing between two things that might sit on the same tray.
This is the mechanism behind an experience most people have had and misdiagnosed: a week of ordinary meals estimates fine, and then one big restaurant dinner or holiday plate quietly swallows several hundred unlogged calories. That was not a lapse in discipline. It was the slope, doing exactly what it does at the top of the range — and it stacks on top of the fact that the reference portions themselves have grown, so "large" arrives more often than it used to.
A whole meal is estimated far better than any item on it#
Here is the part that rarely gets said, and it is genuinely good news. Per-item errors of 20 to 40 percent sound like they should destroy a day's total. They mostly don't, because a real meal contains items at both ends of the slope, and the two ends push in opposite directions.
Nelson's group tested that directly. Once butter and margarine were excluded, nutrient estimates for whole meals derived from photographs were typically within ±7 percent of the measured values3. Items miss by tens of percent; the meal they add up to misses by single digits. The overestimated small side dish is quietly paying for the underestimated main.
That is why it is a category error to read a per-item lab figure as if it were your daily accuracy — and why the honest verdict on eyeballing is much kinder than the individual numbers suggest. It also sets a rule for how to work: estimate the plate, not each ingredient in isolation, and resist the urge to correct one component you feel sure about, because a lopsided correction breaks the cancellation that was doing the work for you.
The two things that never cancel#
Cancellation has limits, and both of them are worth knowing by name.
Fats break the pattern. Butter and margarine had to be excluded from that ±7 percent result because they were substantially overestimated in both Nelson studies, and margarine was the single worst item in the Japanese data at +34.0 percent. Small, dense, and always sitting at the bottom of their own range, spreads land squarely in the zone where the slope inflates. In a lab that means a spread gets logged high. In a kitchen it usually goes the other way, because the fat that matters is the oil already absorbed into the food, and an ingredient you cannot see does not get an estimate at all — a different failure entirely, covered in the calories people forget.
An omission is not an estimate. The slope only applies to food you are actually looking at. Anything you never look at — the cooking oil, the handful in passing, the third of a beer — enters the log as zero, and zero has no error bar to cancel against. Eyeballing failures and forgetting failures get lumped together as "bad tracking" and they behave nothing alike.
Your body size tilts the line#
The slope is not identical for everyone, and the tilt is inconvenient. In Nelson's first study, participants with a BMI of 30 or above underestimated portion sizes by roughly 8 percent overall2. In the follow-up, energy and fat estimated from photographs came out 5 to 10 percent above measured values for people with a BMI under 25, and 2 to 5 percent below for those at 30 or above3.
Read that carefully rather than dramatically. These are single-digit shifts sitting on top of a much larger per-item slope, and they are far too small to explain anyone's weight. What they do say is that the person most likely to be tracking for weight loss has a bias pointing in the least helpful direction — and it is a small, structural nudge rather than anything about willpower or self-deception. Age tilts the line too: older subjects overestimated more often, with the over-65 group running 15 to 20 percent high on energy and fat3.
What actually changes the number#
Given all that, the useful interventions are the ones that change what you compare against, not how hard you look.
Compare against a graded series, never a single average. This is the sharpest result in the older literature and the most actionable. Nelson's volunteers estimating against a series of eight photographs spanning the 5th to 95th percentile of real portion weights produced mean errors of −4 to +5 percent. The same people estimating against one photograph of an average portion produced errors of −23 to +9 percent2. An average reference is the flat slope built into a tool: it drags everything toward the middle, which is the error you were already making unaided.
Expect expertise to buy precision, not truth. When older adults, younger adults and nutritionists all estimated self-served buffet portions, the two age groups performed similarly, and the nutritionists' advantage was that they varied less rather than that they were centered better5. Tighter spread is worth something — it makes your week comparable to your last week — but do not expect training to move the middle.
Give the tails a physical anchor. The two ends of the range are where you are wrong, so those are the two places to spend a measurement: the very small dense things (oil, nut butter, cheese) and the unusually large plate. Everything mid-range you can eyeball and forget. The rest of the no-scale toolkit is in estimating calories without a scale, and if you would rather use the instrument attached to your arm, hand portions work as a ruler and fail as a cup.
Do not assume a camera flattens the slope. Photographing the plate is an excellent capture method and a mediocre measurement — automated systems inherit the same size problem the eye has, which is the subject of how accurate AI photo calorie counters are.
The old warning about eyeballing was that it is unreliable. The better warning is that it is predictable: reliably generous with small servings, reliably stingy with large ones, and reliably fine in between. Once you know which end of the slope you are standing on, you know whether tonight's number needs help.
FAQ#
Do I overestimate big portions or small ones?#
Small ones. Across 1,886 comparisons the smallest servings were overestimated by a mean of 43 percent and the largest underestimated by a mean of 21 percent, with mid-range portions under 7 percent off1. Practically: the snack you feel guilty about is probably smaller than you logged, and the large plate is probably bigger.
Does eyeballing get more accurate across a whole meal?#
Yes, substantially — because the two ends of the slope work against each other. Once spreads were excluded, whole-meal nutrient estimates from photographs typically landed within ±7 percent of measured values, despite far larger errors on individual items3. Estimate the plate as a whole rather than auditing each component.
Do nutritionists eyeball portions better than everyone else?#
Less variably, which is not the same thing. When older adults, younger adults and nutritionists estimated the same self-served portions, the age groups performed similarly and the nutritionists' estimates were mainly tighter rather than better centered5. Training reduces scatter; it does not remove the underlying bias.
Sources#
- Salvesen L, Engeset D, Øverby NC, Medin AC. Development and evaluation of image-series for portion size estimation in dietary assessment among adults. J Nutr Sci. 2021;10:e3.
- Nelson M, Atkinson M, Darbyshire S. Food photography. I: The perception of food portion size from photographs. Br J Nutr. 1994;72(5):649-63.
- Nelson M, Atkinson M, Darbyshire S. Food photography II: use of food photographs for estimating portion size and the nutrient content of meals. Br J Nutr. 1996;76(1):31-49.
- Shinozaki N, Murakami K. Accuracy of estimates of serving size using digitally displayed food photographs among Japanese adults. J Nutr Sci. 2022;11:e105.
- Timon CM, Cooper SE, Barker ME, et al. A comparison of food portion size estimation by older adults, young adults and nutritionists. J Nutr Health Aging. 2018;22(2):230-236.
- Lansky D, Brownell KD. Estimates of food quantity and calories: errors in self-report among obese patients. Am J Clin Nutr. 1982;35(4):727-32.