Two ladles from the same pot are not the same food#
A soup, stew or casserole carries two independent errors, and almost everyone tries to fix the wrong one. The first is how much you served yourself. The second is what was in what you served — and that one is much larger, because a pot of stew is not a uniform substance with an average calorie density. Fat rises, solids settle, and the ladle takes whatever happened to be in its path.
The size of that second error has been measured. When researchers weighed and analysed individual bites in a semi-naturalistic meal setting, the coefficient of variation in energy per gram across bites was 1.9 percent for a homogeneous food (brioche) and 41.2 percent for a heterogeneous one (chicken with artichokes)1. Same dish, same eater, same meal: the energy density of one mouthful is nothing like a fixed property of the food.
So the method that works is the opposite of looking up a dish. Decompose the pot into its components, serve with the same vessel every time so the quantity error becomes a constant, stir before you serve so the composition error shrinks, and log a range. The rest of this article is why each of those four steps is doing a different job.
The quantity error is the easy half#
Start with the half people worry about, because it turns out to be nearly solved by a piece of equipment.
Soups and stews are the purest "amorphous" foods — no unit structure, no fixed shape, no edges to judge — and eyeballing them is genuinely hopeless, an argument already made in full in estimating calories without a scale. But that is a fact about eyeballing, not about the food. Give the same dish a fixed vessel and the picture changes completely.
A meal audit of 'Meals on Wheels' South Australia weighed 120 menu items — 20 soups, 20 mains and 20 desserts in each of two formulations — prepared over five weeks in a kitchen working to written serve-size specifications. Soups came out the most consistent course of the three, at a coefficient of variation of 3 percent, against 6 percent for mains and 8 to 10 percent for desserts2. The liquid dish, the one with no shape at all, was portioned more reliably than the solid ones — because a ladle is a measuring instrument and a serving spoon is not.
There is a second finding in that audit worth more than the first. The measured soups averaged 198 grams against a prescribed 265, and the mains 372 grams against a prescribed 435 — consistently 15 to 25 percent short of specification, my arithmetic on their figures2. Precise and wrong, in the same direction, every time. That is the good kind of error: an offset that repeats cancels out of a week-to-week comparison, which is the whole argument for consistency over accuracy in the accuracy stack. Pick a ladle, use only that ladle, and you have converted a random error into a fixed one you can live with.
The composition error is the hard half#
Now the part no vessel fixes.
The bite study is the clearest window into it. Across 400 analysed bites, mean energy was 21.5 ± 14.4 kcal per bite, ranging from 6.1 kcal for a bite of vegetable soup to 39.0 for a bite of tagliolini1. The authors' own headline conclusion is that "the variability in the energy content per bite is affected by bite volume and mass, much more than by inhomogeneity in food texture" — and they are right about what they measured. But read that alongside the per-gram figures and it points somewhere useful rather than reassuring. Mass dominates the energy of a bite you have not weighed. Once you have weighed it — which is exactly what a fixed ladle does for you — mass is no longer varying, and the 41.2 percent per-gram spread is what is left standing.
The mechanism is physical and completely ordinary. Rendered fat and oil are less dense than the liquid and float. Meat, beans and root vegetables are denser and sink. Starch thickens the middle. Left alone on a low heat for twenty minutes, a pot organises itself into layers, and a ladle dipped deep is a different food from one that skims.
A ladle is a sample, and a stew is not a well-mixed one. The laboratory's answer to that problem is a blender. Yours is a spoon, used before you serve rather than after.
That is not a joke. Analytical chemistry homogenises a food before subsampling precisely because a scoop of a heterogeneous material reports the composition of whatever it caught, not of the bulk. Stirring the pot for ten seconds before serving is the domestic version of the same step, and it is the only intervention available that attacks the composition error directly.
Your app's "beef stew" is an average of stews#
The third thing worth knowing is what the entry you are logging against actually represents — and for this food category specifically, the answer is unusual.
Three-quarters of the food codes in the USDA's Food and Nutrient Database for Dietary Studies are not measurements. Their "nutrient profiles… were generated using a recipe calculation process utilizing two or more ingredients," and the agency is direct about what those recipes are: "The 'recipes' are not cookbook-style recipes, but rather calculated nutrient values based on ingredient proportions. A recipe calculation does not usually reflect a specific recipe for an item; but rather selects ingredients and amounts to estimate a nutrient profile that may represent several variants of a particular food or beverage"3.
"Recipe calculations are developed to represent multiple variants of a basic dish." — USDA Food and Nutrient Database for Dietary Studies, 2021–2023 documentation
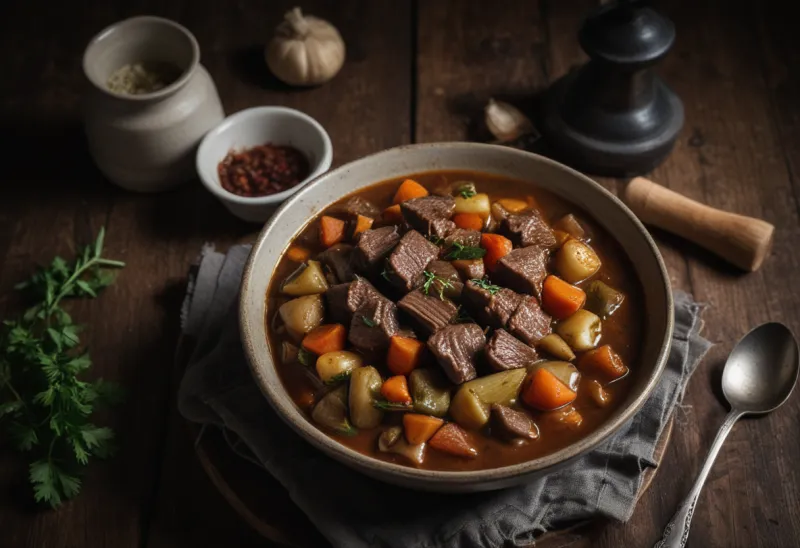
And mixed dishes are where this dominates. The documentation names the categories outright: recipe calculation was "the most common technique used to generate nutrient data for the approximately 400 FNDDS food codes new/updated" for "soups, stews, chili, hot cocoa as well as plant-based milks/yogurts"3. So when you resolve your dinner to "beef stew," you are matching it to a profile deliberately constructed to sit in the middle of many stews. It is not wrong. It was never trying to be your stew.
One detail matters more than the rest for calories. Retention factors and moisture adjustments are applied during the calculation, but fat is handled differently: "Any increase or decrease in fat during cooking is incorporated into the ingredients; therefore, recipe calculations do not include any fat change — gain or fat loss during cooking"3. The fat in the entry is whatever the modelled ingredient list contained. The extra glug you added to the pan is outside the model entirely — a different failure from the raw-versus-cooked derivation problem worked through in why homemade meals are hardest to count, and one more reason two apps hand you different numbers for the same bowl.
Both levers move, and they multiply#
One more reason a mixed dish resists a single number: the two things you have to estimate do not trade off against each other, they stack.
Thirty-nine women were served a lunch entrée formulated at two energy densities (5.23 or 7.32 kJ/g), each in three portion sizes (500, 700 or 900 g). "Subjects consumed 56% more energy (925 kJ) when served the largest portion of the higher energy-dense entrée than when served the smallest portion of the lower energy-dense entrée," and the authors concluded that "energy density and the portion size of a food act independently to affect energy intake"4. The unsettling detail is what the participants noticed: no systematic differences in ratings of hunger and fullness across conditions.
For estimation, the lesson is that getting the ladle right buys you nothing if you have the density wrong, and vice versa. A casserole can be 500 grams at a low density or 900 at a high one, and appetite reports the same thing in both cases.
A method that survives all of this#
Decompose into four buckets, not into ingredients. Protein, starch, fat, and vegetables-plus-liquid. You are trying to estimate the mass of each bucket in the whole pot, not to reconstruct a recipe — and the fat bucket is the one to be most careful with, since it is the densest and the least visible.
Stir, then serve with the same vessel. Stirring attacks the composition error; the fixed vessel converts the quantity error into a repeatable offset. Ten seconds buys more accuracy here than any amount of squinting at the bowl.
Log the fat as its own line. It sits outside the database's recipe model, it is the ingredient you added off-recipe, and isolating it means a later correction touches one number.
Divide and check. Take your estimate, divide it by the served weight, and ask whether the resulting calories per gram is plausible for a dish that is mostly water with solids in it — a broth-based soup lives well under 1 kcal/g, a creamy or oil-finished stew comfortably above it. The check is set out in using calorie density to sanity-check an estimate, and mixed dishes are where it is most informative, because water dominates the mass and cannot hide.
Then log a band. Not because the dish is unknowable, but because you now know exactly which two quantities you are uncertain about and roughly how much each one moves. That is a better position than a confident single number has ever put anyone in — and if you built the pot yourself, counting the recipe rather than the serving is the version of this with the fewest unknowns.
FAQ#
How do you count calories in a soup or stew?#
Estimate the whole pot from its components, then take a repeatable fraction of it. Decompose into protein, starch, fat and vegetables-plus-liquid; stir before serving so the ladle takes a representative mixture; use the same vessel every time so your serving error is constant rather than random. Logging against a generic database entry skips both steps and inherits a profile built to represent many versions of the dish at once3.
Why do two servings from the same pot have different calories?#
Because a pot is not uniform. Fat floats, dense solids sink, and a ladle samples rather than divides. Measured across individual bites, energy per gram varied by 1.9 percent for a homogeneous food and 41.2 percent for a heterogeneous one1. Two equal-weight servings can therefore carry genuinely different amounts of energy, and stirring is the only cheap fix.
Is a database entry for "beef stew" accurate?#
It is accurate as a representative, which is a different thing. Three-quarters of USDA FNDDS food codes are generated by recipe calculation, and soups, stews and chili are the categories where the technique dominates; such entries are "developed to represent multiple variants of a basic dish" rather than any one of them3. Fat added during cooking sits outside the calculation entirely, so a generously oiled pot will run above the entry every time.
Sources#
- Bhuyan MJ, Vedovelli L, Lanera C, Gasparini D, Berchialla P, Baldi I, Gregori D. Analyzing the caloric variability of bites in a semi-naturalistic dietary setting. Nutrients. 2025;17(13):2216.
- Arjuna T, Miller M, Soenen S, Chapman I, Visvanathan R, Luscombe-Marsh ND. Serve size and estimated energy and protein contents of meals prepared by 'Meals on Wheels' South Australia Inc.: findings from a meal audit study. Foods. 2018;7(2):26.
- U.S. Department of Agriculture, Agricultural Research Service. USDA Food and Nutrient Database for Dietary Studies 2021-2023: Documentation. Food Surveys Research Group; 2024.
- Kral TVE, Roe LS, Rolls BJ. Combined effects of energy density and portion size on energy intake in women. Am J Clin Nutr. 2004;79(6):962-968.
Source: BurnWeek — "How to estimate calories in soups, stews and casseroles", https://burnweek.fit/blog/estimating-calories-in-mixed-dishes/. Licensed CC BY 4.0: free to quote or reuse with a link to this page.