A slice is a count, not a quantity#
A slice of pizza has no calorie count until you settle how big the slice is — and the word "slice" settles nothing. When researchers bought 25 popular Margherita pizzas from UK and international chains, supermarket chillers and freezers, and recipe sites, the portions sold as standard ranged from 200 to 562 calories at weights of 245 to 504 grams1. One dish, three core ingredients, a 2.8-fold spread.
For a working number, stop counting slices and price the grams. Pizza is bread plus cheese, and both sit in the medium energy-density band of 1.6 to 3.9 kcal/g5. That puts a modest 120-gram slice somewhere between roughly 190 and 470 calories, and a heavy 200-gram slice between 320 and 780 — my arithmetic on that band, not a measured figure. Narrowing it is not a matter of hunting a better database entry. It is a matter of settling the two things the word "slice" leaves open: how much pizza you picked up, and how much fat is riding on it.
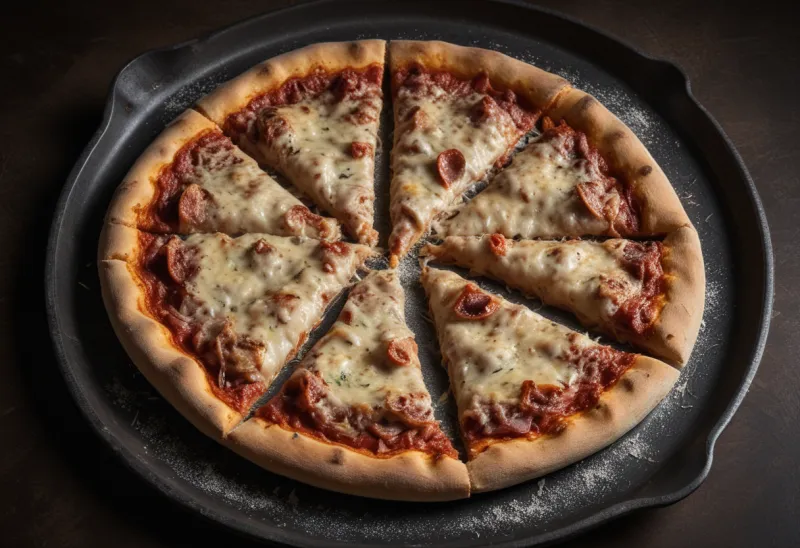
Start with the first, because it is pure geometry and most people never do it. A pizza's area grows with the square of its diameter, so a 16-inch pie covers about 201 square inches against 113 for a 12-inch. Cut both into the usual eight, and one slice off the larger pie is 78 percent more food than one off the smaller — same word, same count, same plate. Cut the 16-inch into six instead of eight and that single slice is 2.4 times the 12-inch eighth. All of that is ordinary circle arithmetic, and none of it shows up in a log that records "2 slices."
Eight is a reliable count of an unreliable object. The number of slices is the one thing about a pizza that holds still while everything underneath it moves.
What 25 Margherita pizzas actually measured#
The Combet survey is worth dwelling on because it holds the recipe constant. Every pizza in it was a Margherita — dough, tomato, mozzarella — sampled from major pizza chains, supermarket fresh and frozen ranges, and popular online recipes. The authors' summary is flat: "There was considerable variation in the nutrient composition of what might appear… to be the same pizza"1.
| What varied across 25 Margherita pizzas | Range as measured |
|---|---|
| Portion weight as sold | 245–504 g |
| Energy per standard portion | 837–2,351 kJ (200–562 kcal) |
| Total fat | 18.3–46.5 % of energy |
| Saturated fat | 4.3–22.9 % of energy |
| Fibre per meal-sized portion | 2.1–9.2 g |
Data: Combet et al., 2013. Fat and fibre figures are standardised to a 600-kcal meal-sized serving; 19 of the 25 exceeded the 11 %-of-energy saturated-fat limit.
Two things fall out of that table. First, portion weight spans a factor of 2.1 while energy spans a factor of 2.8 — and if calories per gram were constant across these pizzas, those two ratios would have to be identical. They are not, so the pizzas differed in richness as well as in size. Second, look at the fat row: at one end fat supplies under a fifth of the energy, at the other nearly half. That is a 2.5-fold difference in how fat-driven the same dish is, and the authors point at the culprit — "the mozzarella cheese on the pizza is also the main source of saturated fat and protein"1. Cheese melts into a flat sheet the moment it hits the oven, so a generous cheese load and a thin one look far more alike than they cost. It is the same reason the general advice for eyeballing food is to measure the fat and eyeball the rest — except on a pizza you cannot measure it, because someone else already put it there.
Size and richness each explain less than half#
There is a tempting shortcut here: pick whichever variable seems bigger and estimate that one well. The data says it does not work, and the demonstration is clean.
In a multisite study that used bomb calorimetry on frequently ordered restaurant meals, Italian food came out as the most energetic of nine cuisines at 1,556 ± 492 kcal per meal, against an overall mean of 1,205 ± 465 kcal and a mean portion weight of 689 ± 261 g2. But the useful finding is methodological: "Both portion weight and meal energy density significantly predicted meal energy content, and portion size was also inversely correlated with energy density. Individually, both portion size and energy density were only weakly predictive of meal energy content (partial R²≤0.25)"2.
Neither lever alone accounts for even a quarter of the variance, and they push against each other — bigger portions tended to be less dense. So an estimate built on size alone ("three slices") or on style alone ("deep dish, so it's a lot") is running on one of two variables that each explain under 25 percent. You need a mass and a density, and the pizza is unusual only in how confidently the count disguises the fact that you have neither. That is also why the broader habit of reading restaurant meals as component estimates beats reading them as dish names.
The typical portion has been growing#
One more reason your internal reference for a slice is miscalibrated: the reference moved. When Australian researchers compared typical portion sizes of the fourteen discretionary foods contributing most to energy intake across the 1995 and 2011–12 national nutrition surveys, ten of the fourteen changed significantly, and pizza posted one of the two largest increases — "+570 kJ… +66% above 1995" per typical portion3. That is about 136 extra calories in what a population calls one serving, over sixteen years.
Not everything grew: the same analysis found typical portions of pastry, snack food and potato fries fell by 10 to 40 percent, so this is not a blanket story about portion inflation. It is specific, and pizza is on the wrong end of it. If your sense of a slice was formed a decade or two ago, it was formed on a smaller object.
Estimating the slice in front of you#
Four moves, in the order that pays off.
Size the pie before you count the slices. Common diameters step 10, 12, 14, 16 inches, and each step is a bigger jump than it sounds: 12 to 14 inches adds 36 percent of area, 14 to 16 adds another 31 percent. Ask or estimate the diameter, then record the fraction you ate — "a quarter of a 14-inch" is a real quantity in a way that "two slices" is not.
Weigh one slice, once, at home. You will never weigh pizza in a restaurant, and you do not need to. A single weighing of a slice from a pizza you buy often gives you a personal gram anchor that survives every future estimate, which is the same trick that works for any repeated meal.
Place it in the density band deliberately. Push toward 3.9 kcal/g for deep-dish, stuffed crust, extra cheese or cured-meat toppings; toward 1.6 for a thin base with vegetables and a light cheese hand. If you want the arithmetic behind that band and how to use it as a check on any estimate, calorie density is a sanity test rather than a lookup.
Then log a range, and make it wide. Pizza has earned it: the measured spread on one recipe was 200 to 562 calories per portion. For a reality check on where a whole pizza meal lands, the best population figure is from children and adolescents: on days they ate pizza, it supplied 408 and 624 calories respectively — 22 and 26 percent of the day's total energy from pizza alone4. Adults eating a shared pizza are not eating less than an adolescent. A band from perhaps 600 to 1,000 calories for a typical pizza dinner is not vagueness; it is what the evidence actually supports, and it is the same reason takeaway containers get estimated by mass first.
FAQ#
How many calories are in a slice of pizza?#
Most commonly between about 190 and 470, and the width is the real answer. Standard sold portions of 25 measured Margherita pizzas ran 200 to 562 calories at weights of 245 to 504 grams1. Applying the medium energy-density band that bread and cheese occupy, 1.6 to 3.9 kcal/g5, a 120-gram slice lands in that 190-to-470 window. Deep-dish, stuffed crust and cured meats push to the top of it.
Should I count pizza by the slice or weigh it?#
Weigh it once, then count. A slice is a count of an object whose size is set by the pie's diameter and how many cuts the kitchen made — a 16-inch pie cut into six yields slices 2.4 times the size of an 8-cut 12-inch, by area alone. Weighing a single slice from the pizza you order most turns a meaningless unit into a personal one, and after that counting works fine.
Is thin-crust pizza actually lower in calories?#
Per slice, usually yes; per gram, not necessarily — and I could not find a study isolating crust style, so treat this as reasoning rather than a measured comparison. Thinner crust mainly removes mass from a same-diameter slice, and mass is one of the two levers that predict meal energy2. It does nothing to the cheese and oil sitting on top, which is where the fat share — anywhere from 18.3 to 46.5 percent of energy — actually lives1.
Sources#
- Combet E, Jarlot A, Aidoo KE, Lean MEJ. Development of a nutritionally balanced pizza as a functional meal designed to meet published dietary guidelines. Public Health Nutr. 2014;17(11):2577-2586.
- Urban LE, Weber JL, Heyman MB, et al. Energy contents of frequently ordered restaurant meals and comparison with human energy requirements and USDA database information: a multisite randomized study. J Acad Nutr Diet. 2016;116(4):590-598.e6.
- Zheng M, Rangan A, Meertens B, Wu JHY. Changes in typical portion sizes of commonly consumed discretionary foods among Australian adults from 1995 to 2011-2012. Nutrients. 2017;9(6):577.
- Powell LM, Nguyen BT, Dietz WH. Energy and nutrient intake from pizza in the United States. Pediatrics. 2015;135(2):322-330.
- Rolls BJ. Dietary energy density: applying behavioural science to weight management. Nutr Bull. 2017;42(3):246-253.